Three costs a backtest hides: funding, slippage and fees on one crypto perp strategy
This case study shows how a borderline profitable crypto futures backtest turns into a losing strategy once funding, slippage and fees are applied. Monte Carlo simulations reveal a 57% probability of loss after realistic costs are included.
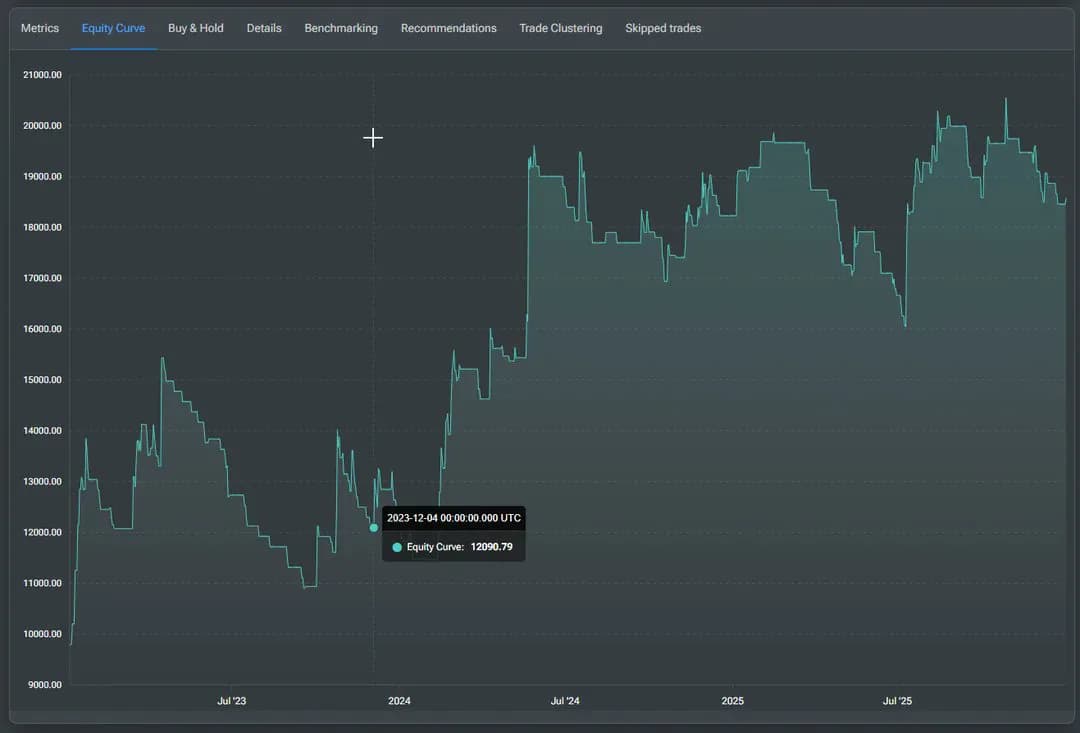
Same strategy, same rules, same period. Top curve is the backtest with costs turned off. Bottom curve is the same strategy once funding, slippage and fees are on.
This is one of the most common ways a profitable backtest turns into a losing account. Below is the same test step by step, with numbers at each step.
The strategy
A simple EMA + ADX entry with a trailing stop, put together in five minutes. The goal was never a production system. It only had to have positive stats, so the effect of costs is easy to see.
Pair: ETHUSDT perpetual
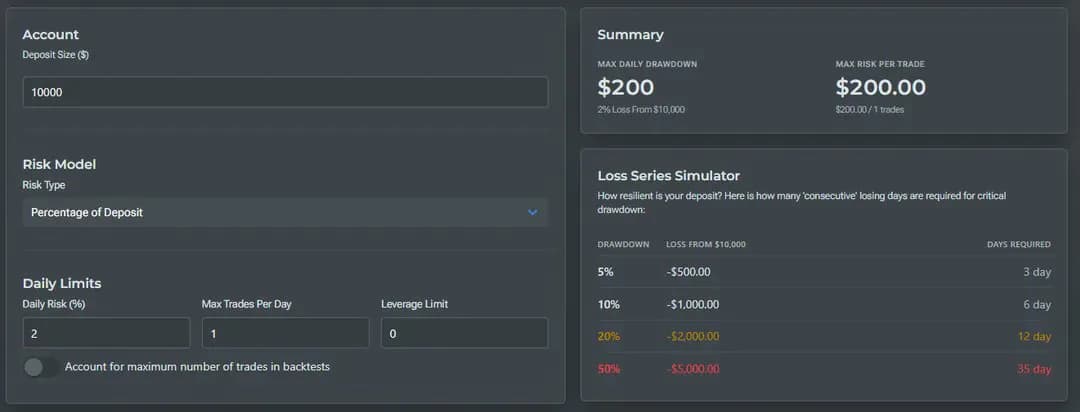
Deposit: $10,000
Risk per trade: 2% (higher than typical, on purpose)
Max trades per day: none
Leverage: uncapped
Mode: 24/7
One thing before the numbers. This is not a claim that every strategy dies once costs are on. A strategy with a wide margin over costs survives them, it just earns less than the clean backtest showed. Borderline strategies are the ones most likely to break. The test shows how large the gap between a cost-free backtest and a tradable result can be, on the kind of strategy where that gap matters most.
The result without costs
Fully automated, no manual intervention.
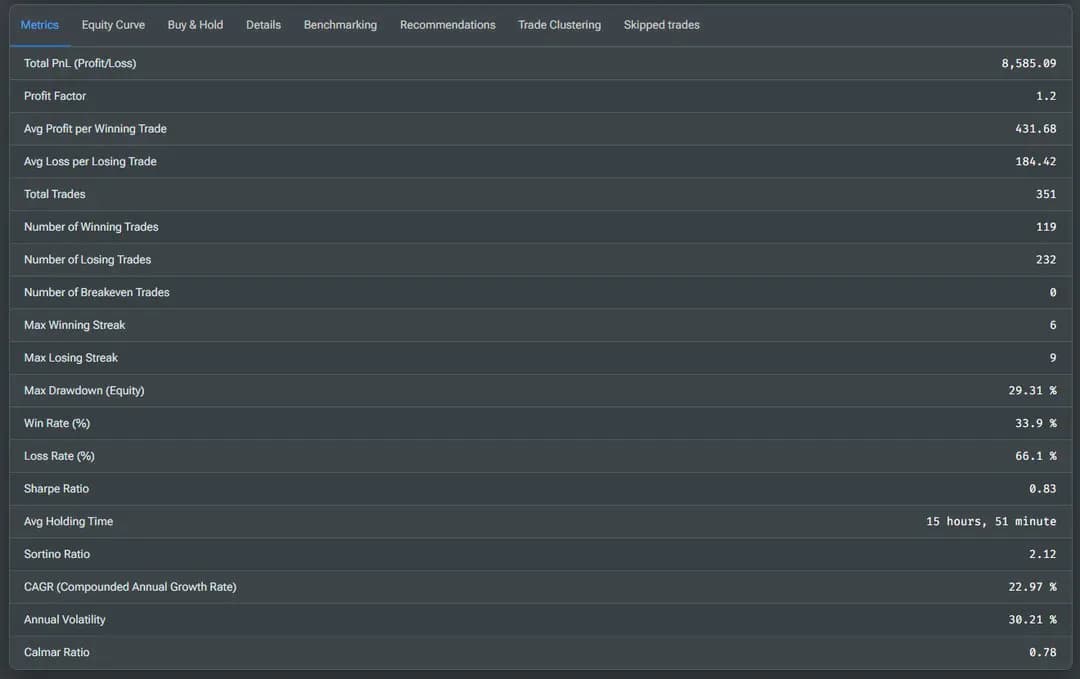
Profit factor 1.20
CAGR 23%
Sharpe 0.83
Max drawdown 29%
Profit factor 1.20 is a borderline result. Neither clearly profitable nor clearly losing. 23% a year looks attractive, but a Sharpe of 0.83 and a 29% drawdown say this is a risky result sitting close to noise.
Where the strategy makes money
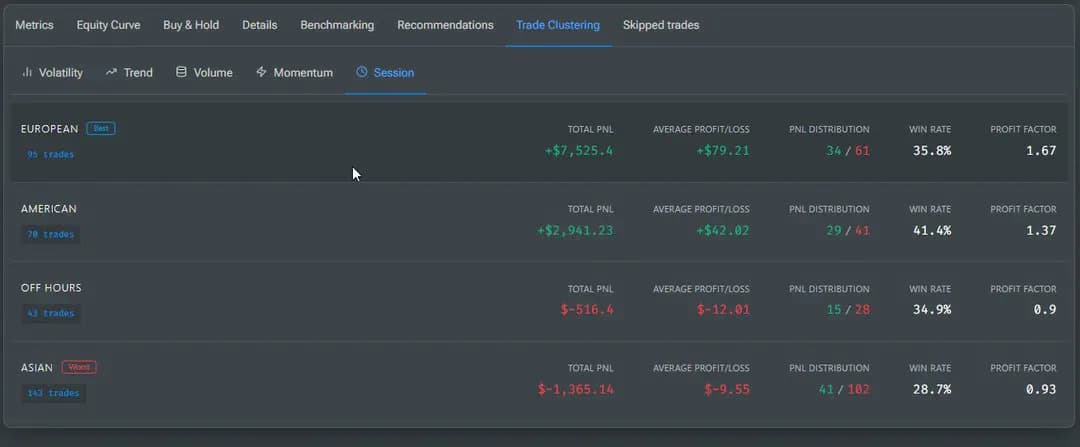
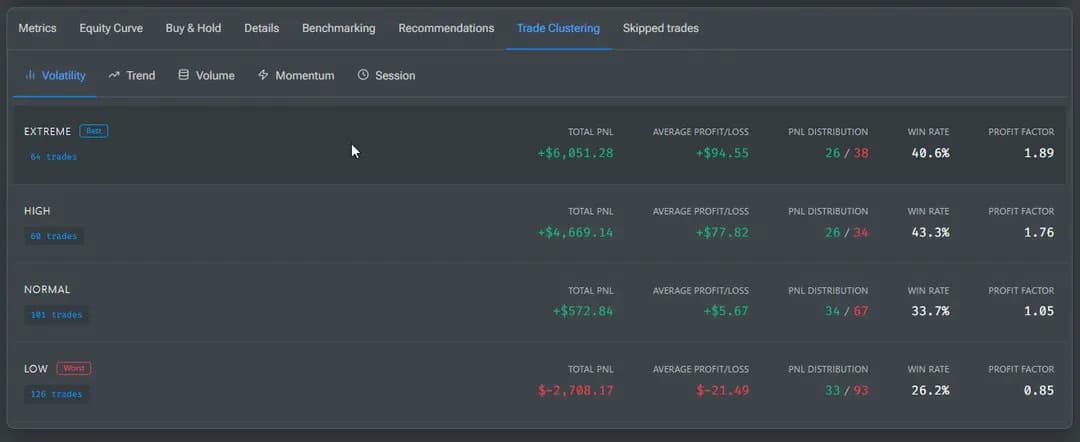
Before adding costs it is worth checking under which conditions the strategy actually makes money. A cluster analysis of trades by volatility regime and trading session gives a clear picture.
The strategy makes money in the high and extreme volatility regimes and in the EU and US sessions. The Asian session and the low volatility regime lose money on a regular basis and dilute the result.
So this is a strategy that works in specific conditions. It is the right kind of strategy for this test.
Monte Carlo before costs
A permutation test reshuffles the order of trades 5,000 times. It does not say whether the rule works. It shows what range of drawdowns and losing streaks the same set of trades could have produced in a different order.
Warning signs already:
Max losing streak 18. Even without costs, up to 18 losing trades in a row. This is close to what most people can hold psychologically.
Worst case -36%. One unlucky reshuffle takes a third of the deposit.
Max drawdown 56% in the worst permutation, against the "smooth" 29% in the base backtest.
Enough reason to be careful. But the point of the test is costs, so we keep going.
Three costs, switched on one at a time
Funding, slippage and fees apply to every strategy, but how much they cost depends on holding time, number of trades, order types, liquidity and position size. A five minute strategy and a production system pay the same funding rate on the same pair. What differs is how often and how long they pay it. If a strategy cannot survive these three, an improved version almost certainly will not survive them either, unless the logic is reworked from the ground up.
In the base backtest all three were disabled on purpose. We turn them on one after another.
Step 1. Funding
Funding is settled every 8 hours on a perpetual. It can work for you or against you, depending on position direction and what the market is doing at the time. In this backtest the funding comes from the real payment history on the pair, so each 8 hour payment is the one that actually happened.
The change is small, but already against us. Small on a single trade, it adds up over holding time. On a strategy that holds positions for days it would be a different story, this one closes trades fast.
Step 2. Slippage
The slippage model here is aggressive, tuned to match real fills on ETHUSDT at average entry sizes.
Slippage took 41% of the profit. This is not a bug in the model, it is a real cost that most backtests skip. In live trading that share of the profit would never have existed in the first place.
We model fills conservatively on purpose. A backtest that is too pessimistic costs nothing. One that is too optimistic costs real money.
Step 3. Exchange fees
The exchange charges on entry and on exit. Here the standard Binance futures taker fee of 0.05% (VIP 1) is used on both.
This is where the strategy dies. Profit factor drops below 1.0, max drawdown goes to almost 47%, CAGR turns negative.
Why the losing streak went from 9 to 19
Why the losing streak went from 9 to 19
The strategy runs a trailing stop. Without costs, a small move in the right direction was enough to trail the stop to break-even or into profit.
Add slippage and fees, and the minimum move needed just to cover costs grows. Trades that used to close at +0.1R or +0.2R now close at zero or in the red. Streaks of barely positive trades turn into streaks of losses, and the drawdown grows with them.
Monte Carlo after costs
The same permutation test, now with funding, slippage and fees on.
Probability of loss 57%. In more than half of the reshuffled paths the account ends below where it started. This is a number inside the permutation model, not a forecast of live results, but it is a very different number from what the clean backtest suggested.
Worst case -133%. The deposit does not just get wiped, the account goes negative, which with leverage means a margin call.
Median final balance $8,608 on a $10,000 start. A typical path loses 14%.
Max drawdown 97.95% in the worst permutation, almost the whole deposit.
Before costs it looked like "risky but profitable". After costs it is a system with negative expectancy.
What this test says
Start: a borderline result, profit factor 1.20. Funding took a little. Slippage took 41%. Fees pushed the rest below zero. Probability of loss in the permutation test: 13% before costs, 57% after.
Two more costs were not even switched on, because the strategy was already below zero:
Market impact. On a thin pair your own order moves the price against you.
Stop and limit order modeling. Real fills on a stop can be worse than the backtest price, and a limit order can stay unfilled.
The cluster analysis showed the strategy makes money in high volatility and in the EU and US sessions. Filter out the other regimes and it might survive the costs. Or it might not. That is a separate test.
Three things to take from it:
Turn costs on before you look at the equity curve. A backtest without funding, slippage and fees is a different strategy from the one you will trade.
Look at which cost hurts most. On this strategy it was slippage and fees, because it takes many short trades. On a strategy that holds for days, funding moves to the front.
Run the same Monte Carlo after costs, not only before. The reshuffle before costs already showed an 18 trade losing streak. After costs the same test says 57% chance of losing money.
Try it on your own strategy
Take a strategy you already have and run it twice: once with all costs off, once with funding, slippage and fees on. Compare profit factor, max drawdown and the longest losing streak. If the second run is a different strategy, the first one was never real.
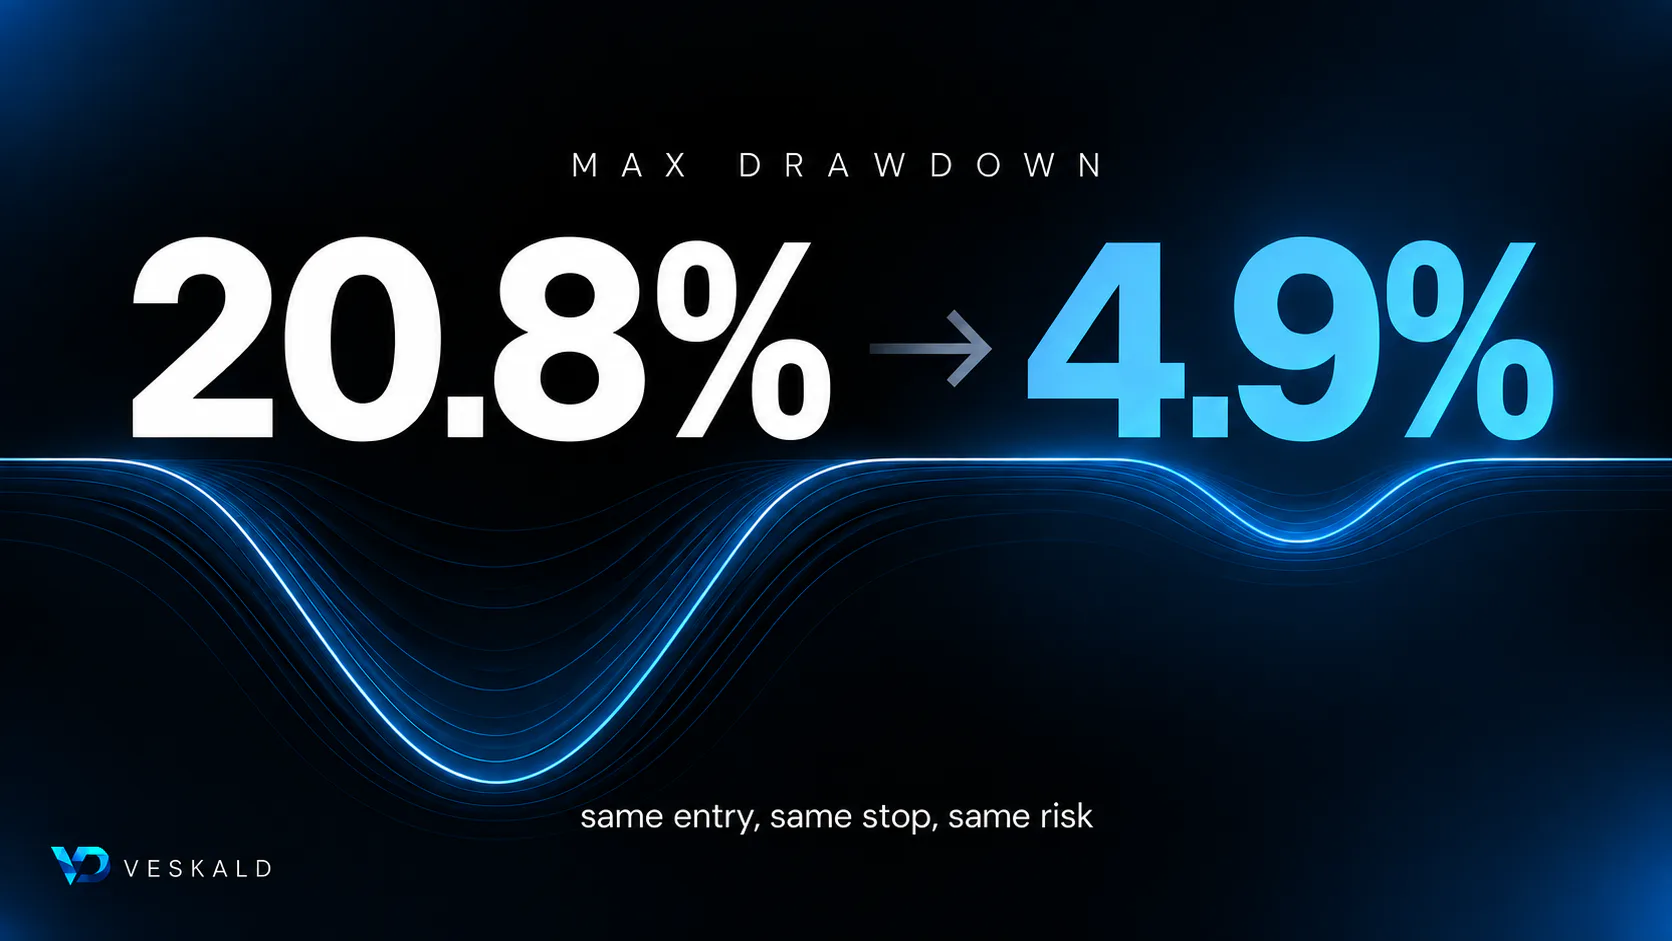
This backtest compares three exit strategies using identical entry rules to show how position management impacts drawdown and profit. Learn why the edge often lies in the exit rather than the entry signal.
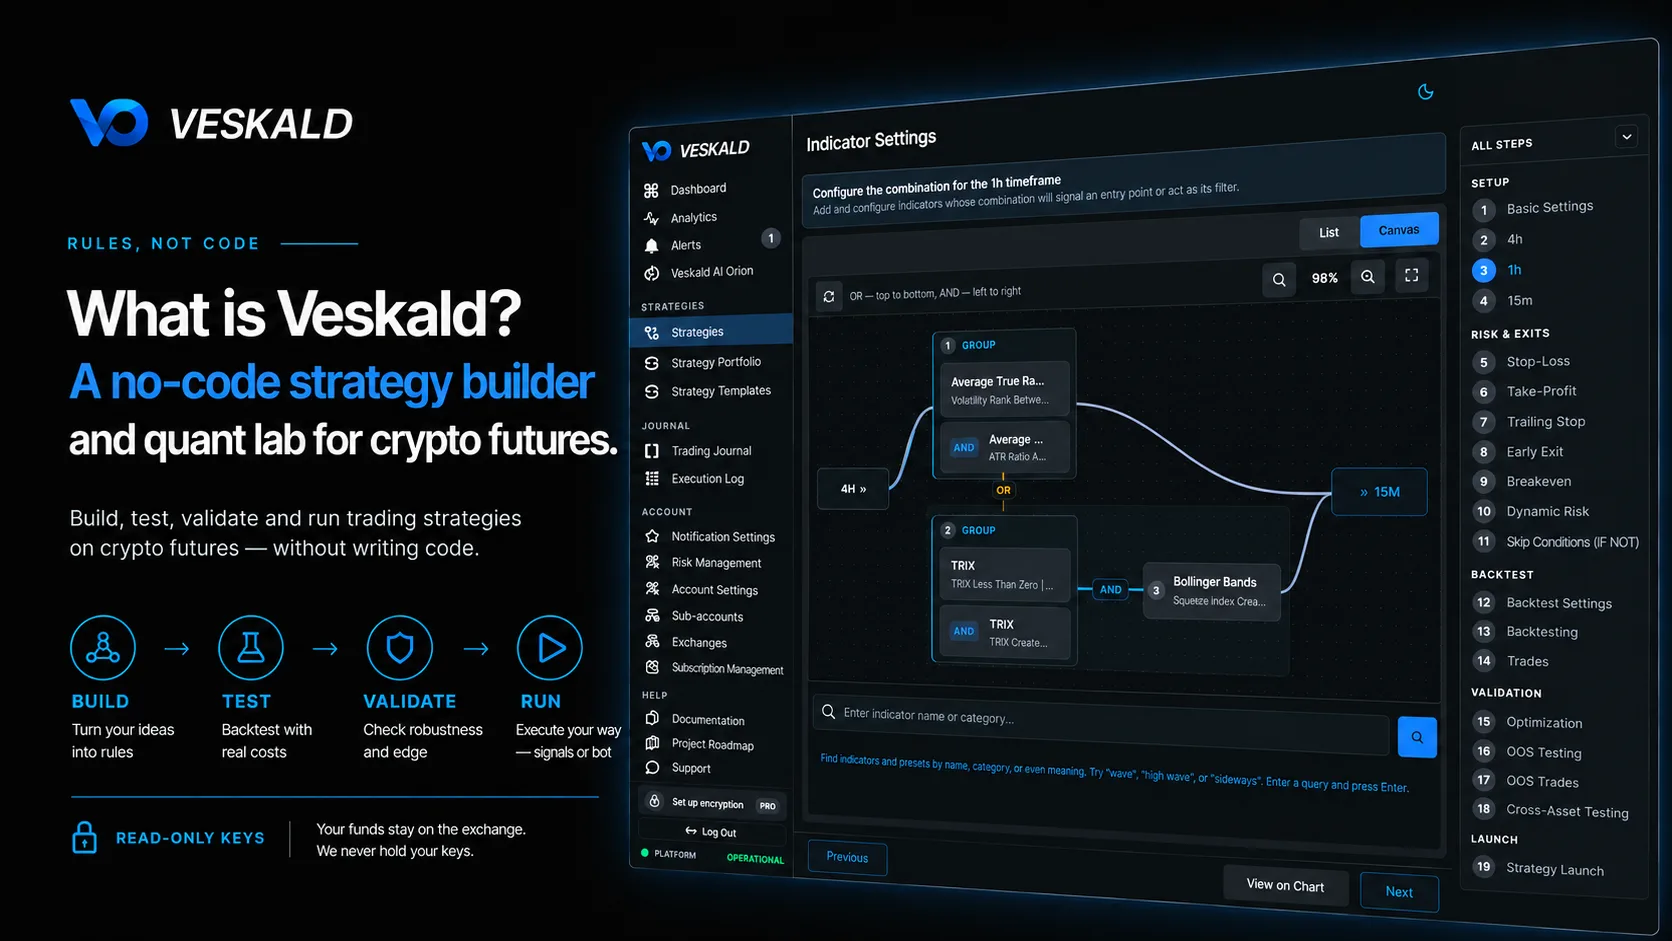
Profitable trading relies more on position management than entry signals. Veskald lets you build entire trade lifecycles as editable rules instead of code, enabling rapid testing of exits, stops, and risk adjustments.
Veskald is a no-code platform for building, testing and running crypto futures strategies. Strategy building, backtesting, validation and analytics in one interface - and execution the way you want it: signals for trading by hand, a bot on your machine, or your own executor in between.