Build edges or kill early. Read the market.
Build, test and run strategies — or trade manually on live market analytics. One interface, the same data.
Strategy builder
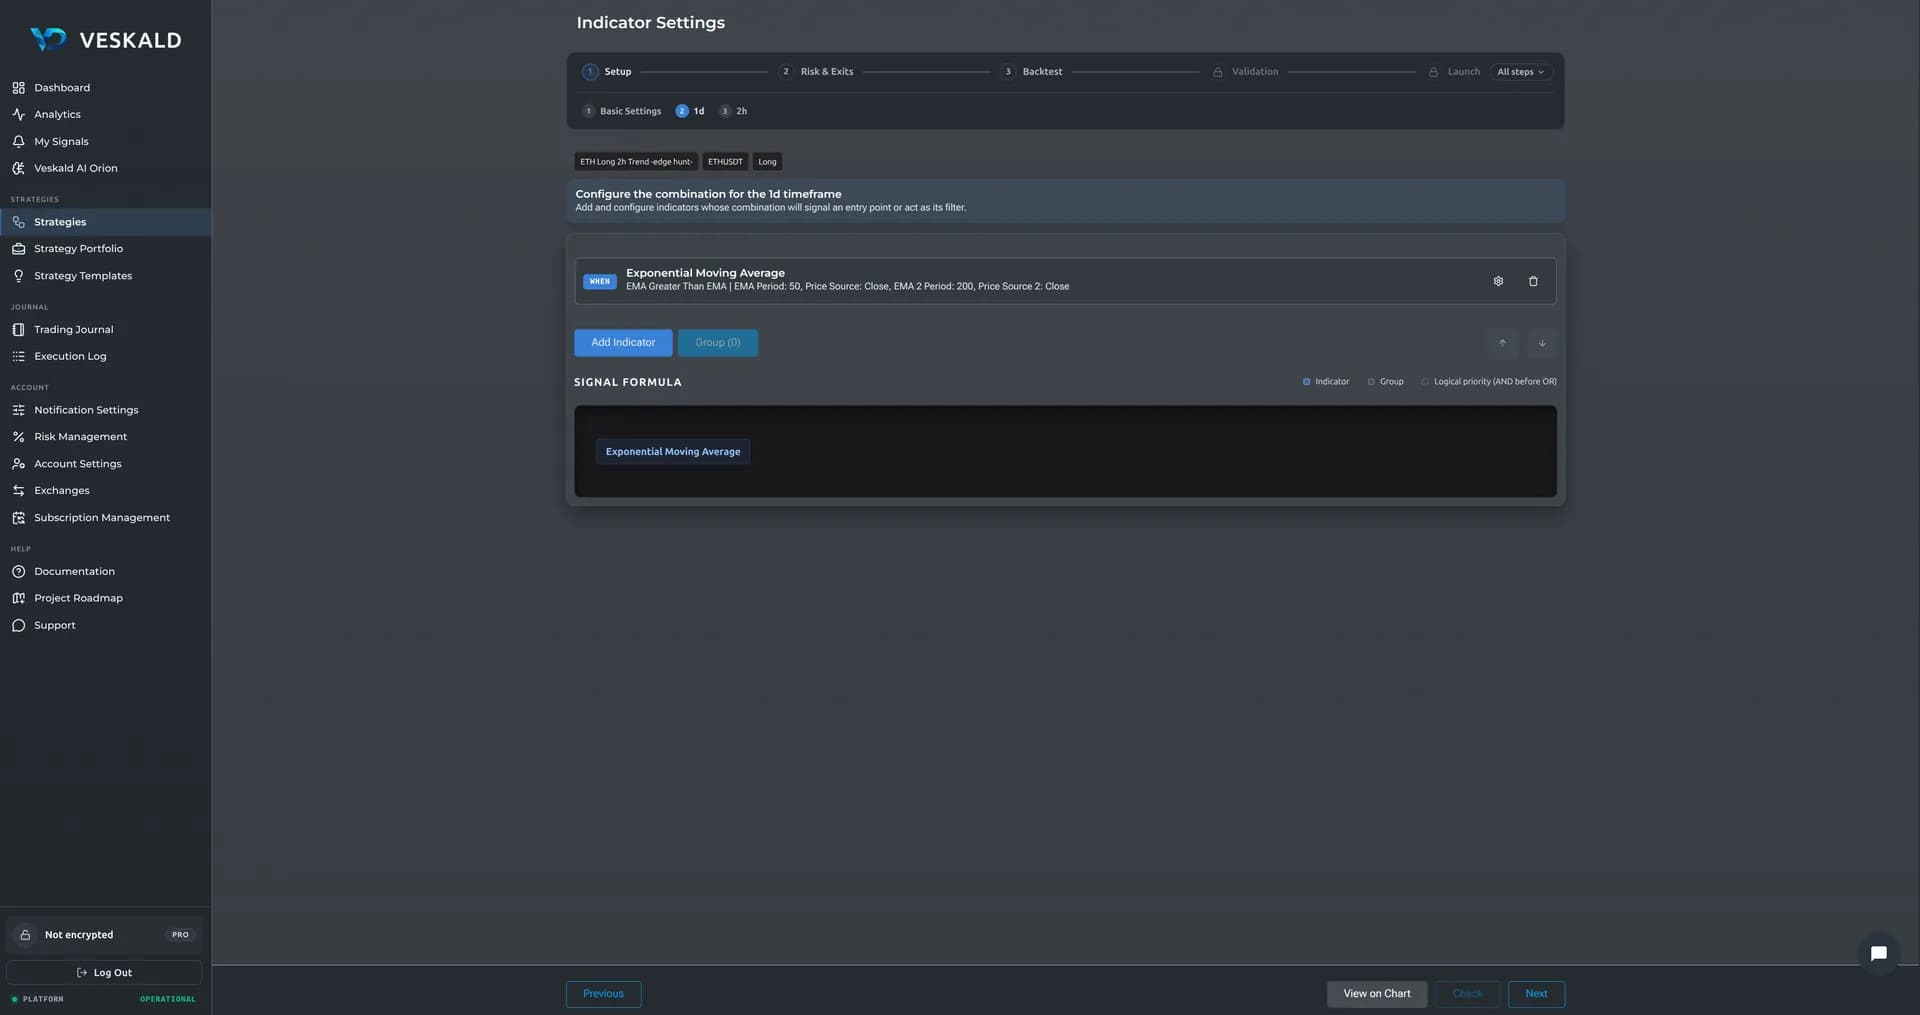
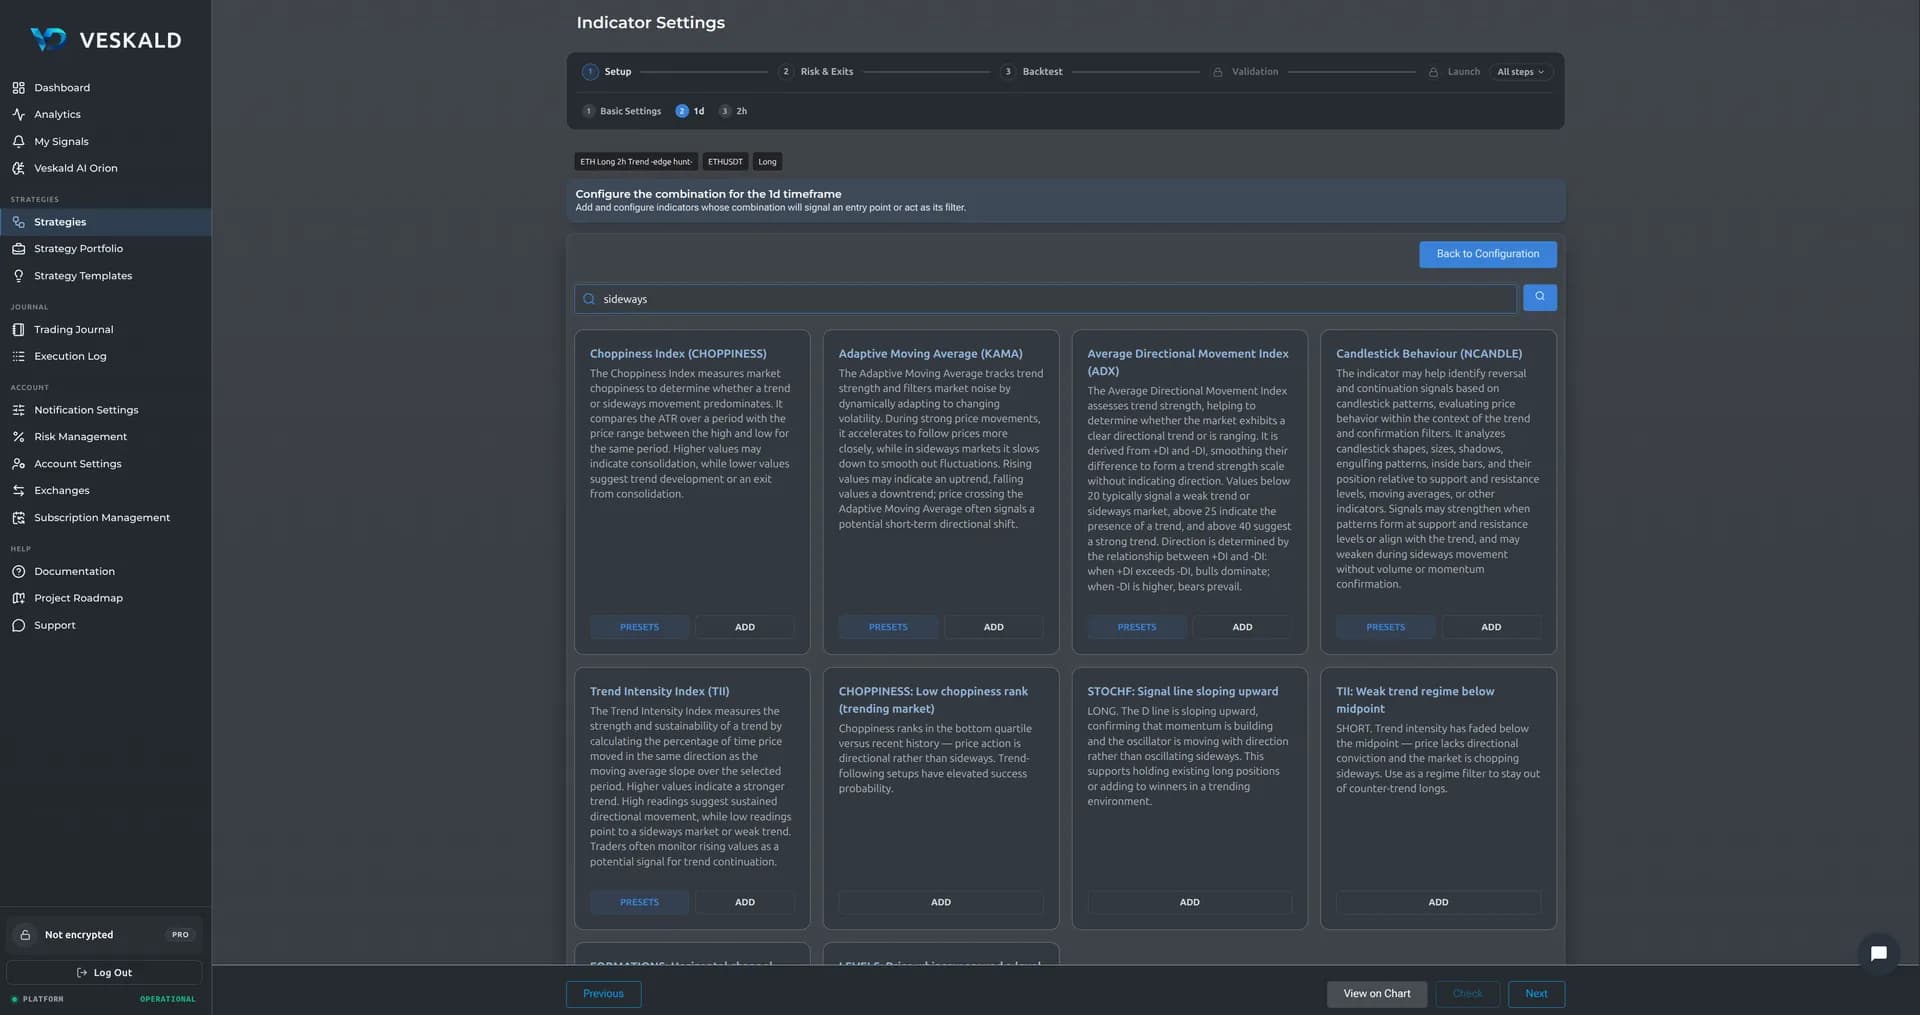
11 steps. Any complexity. No code.
The list of indicators and conditions is constantly expanding.
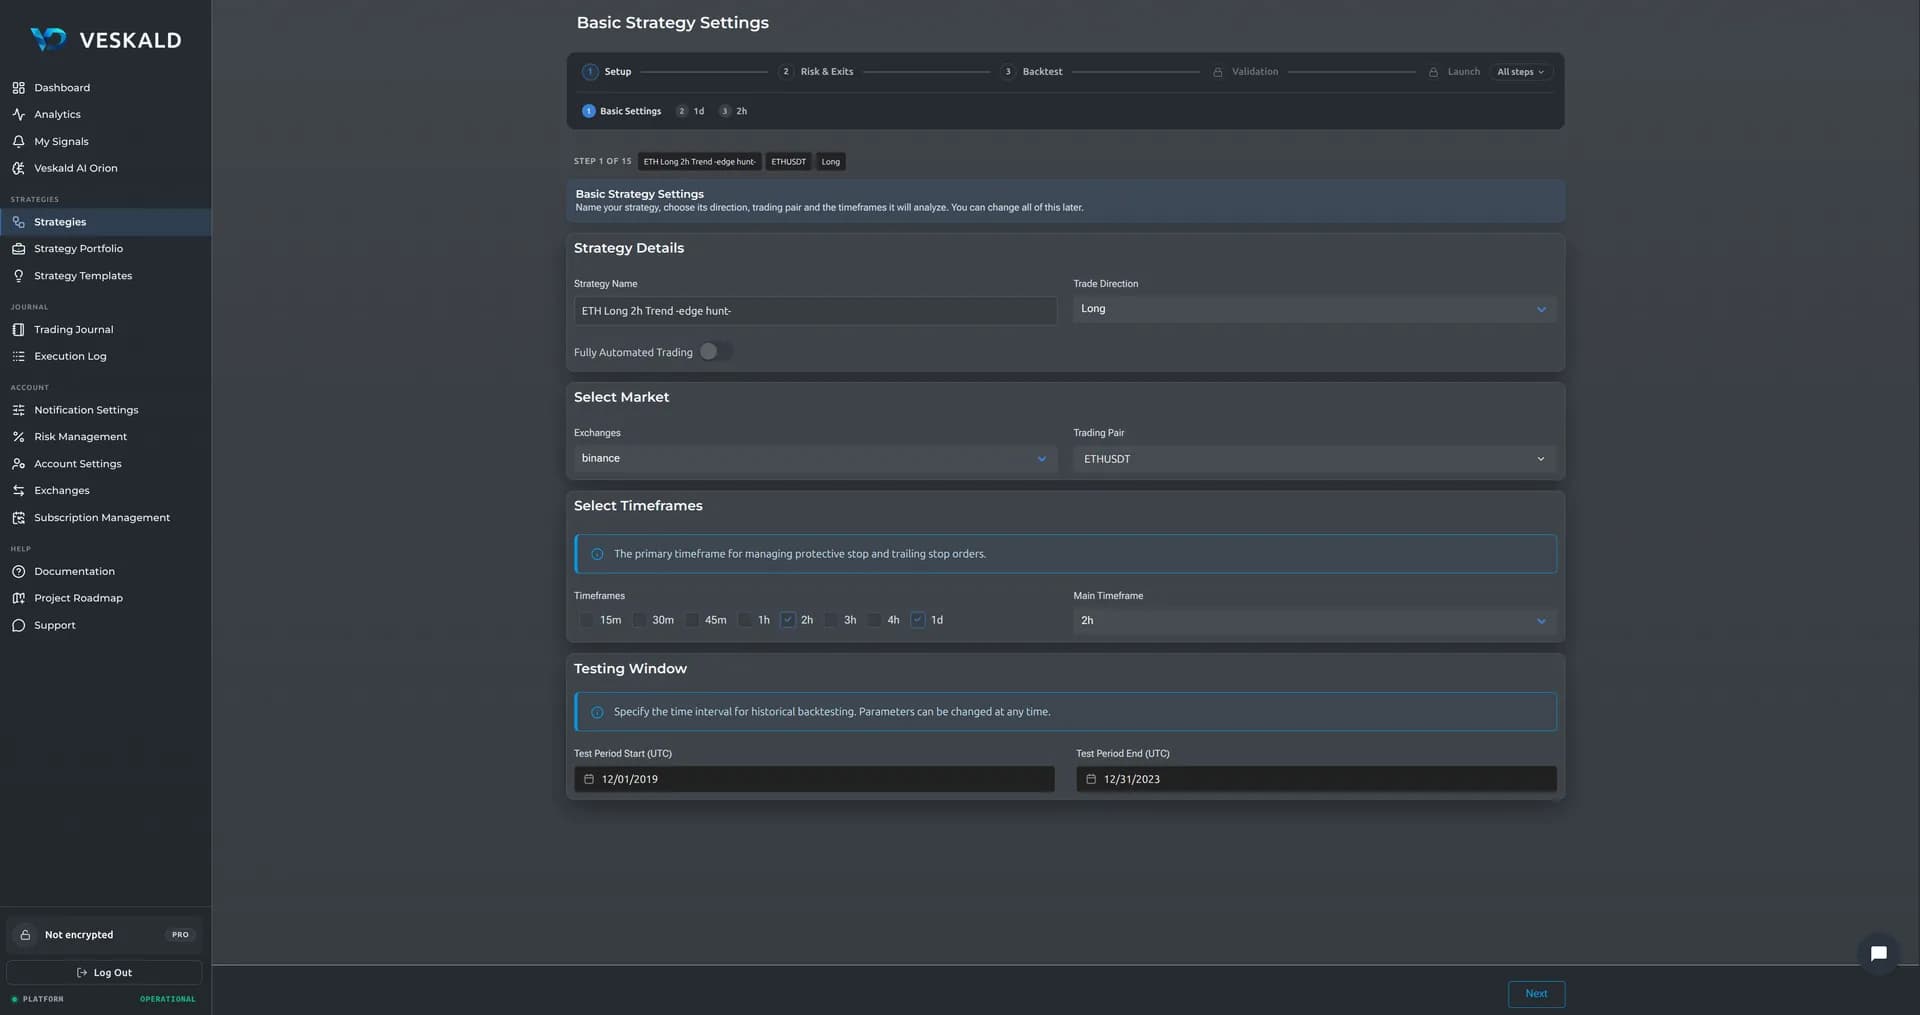
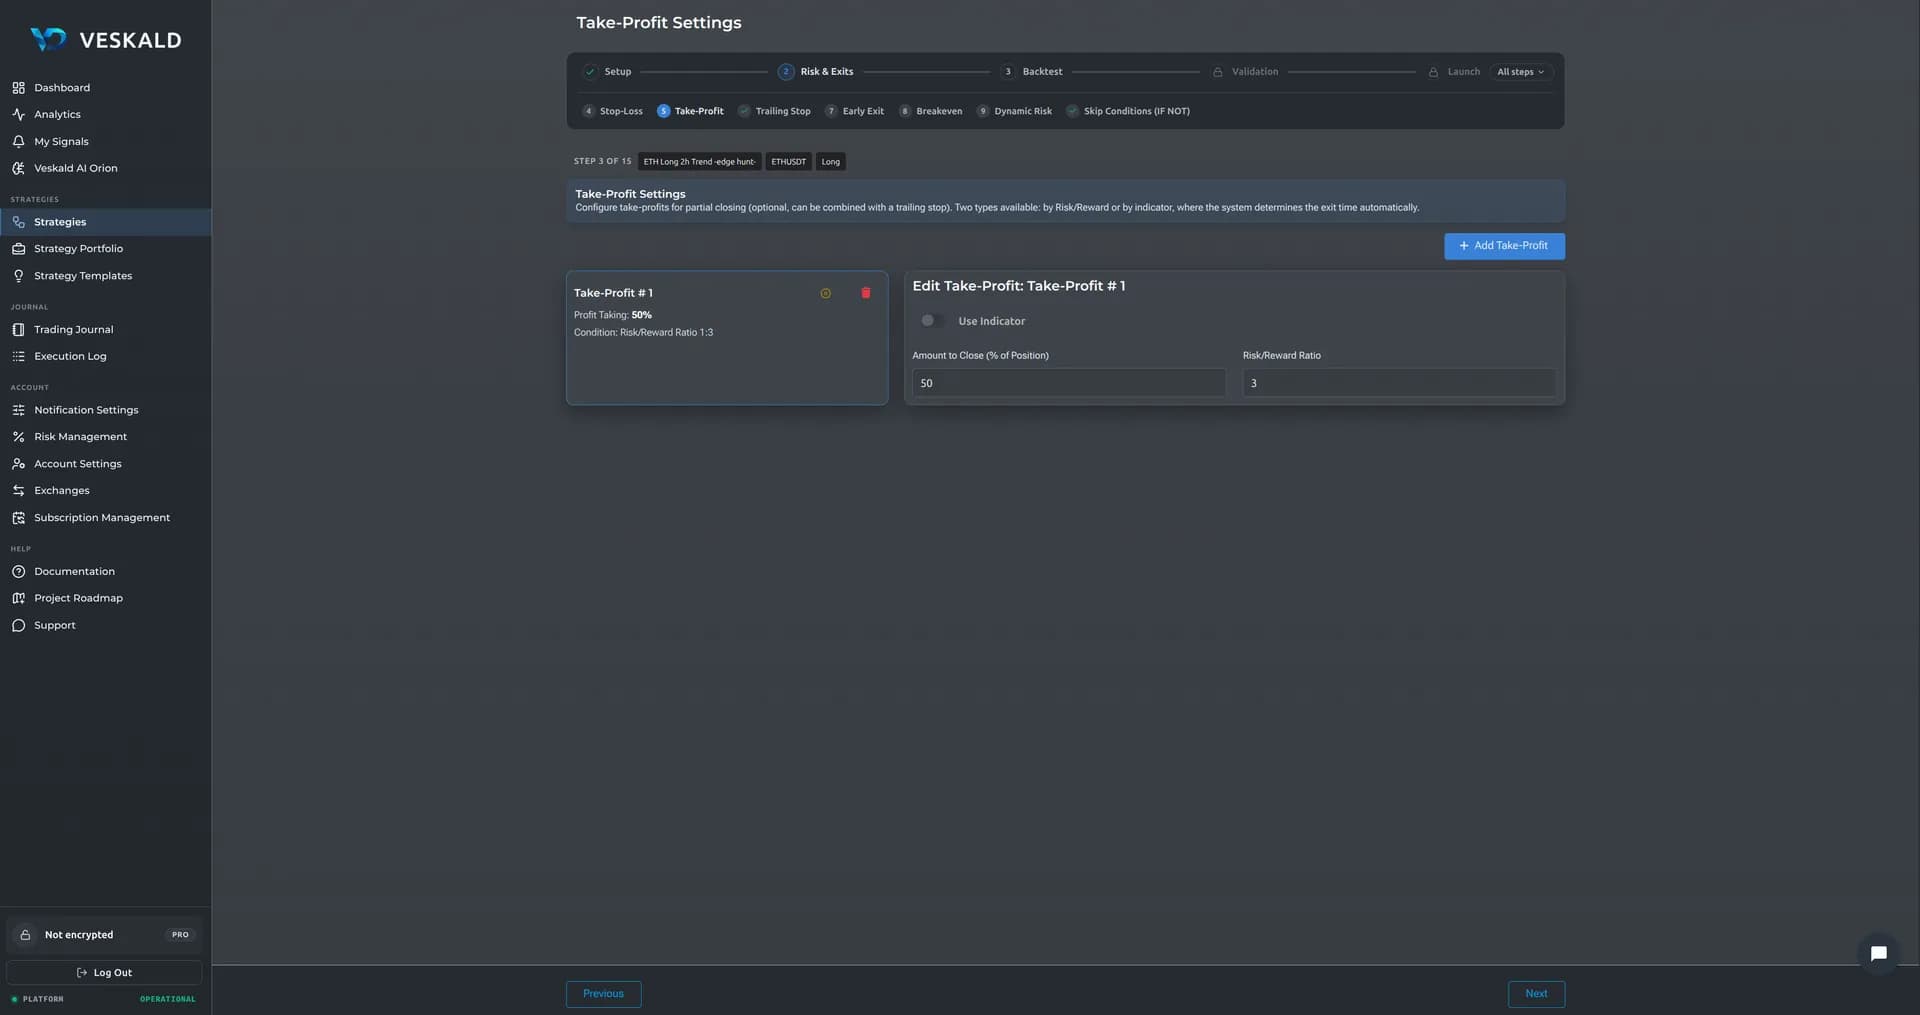
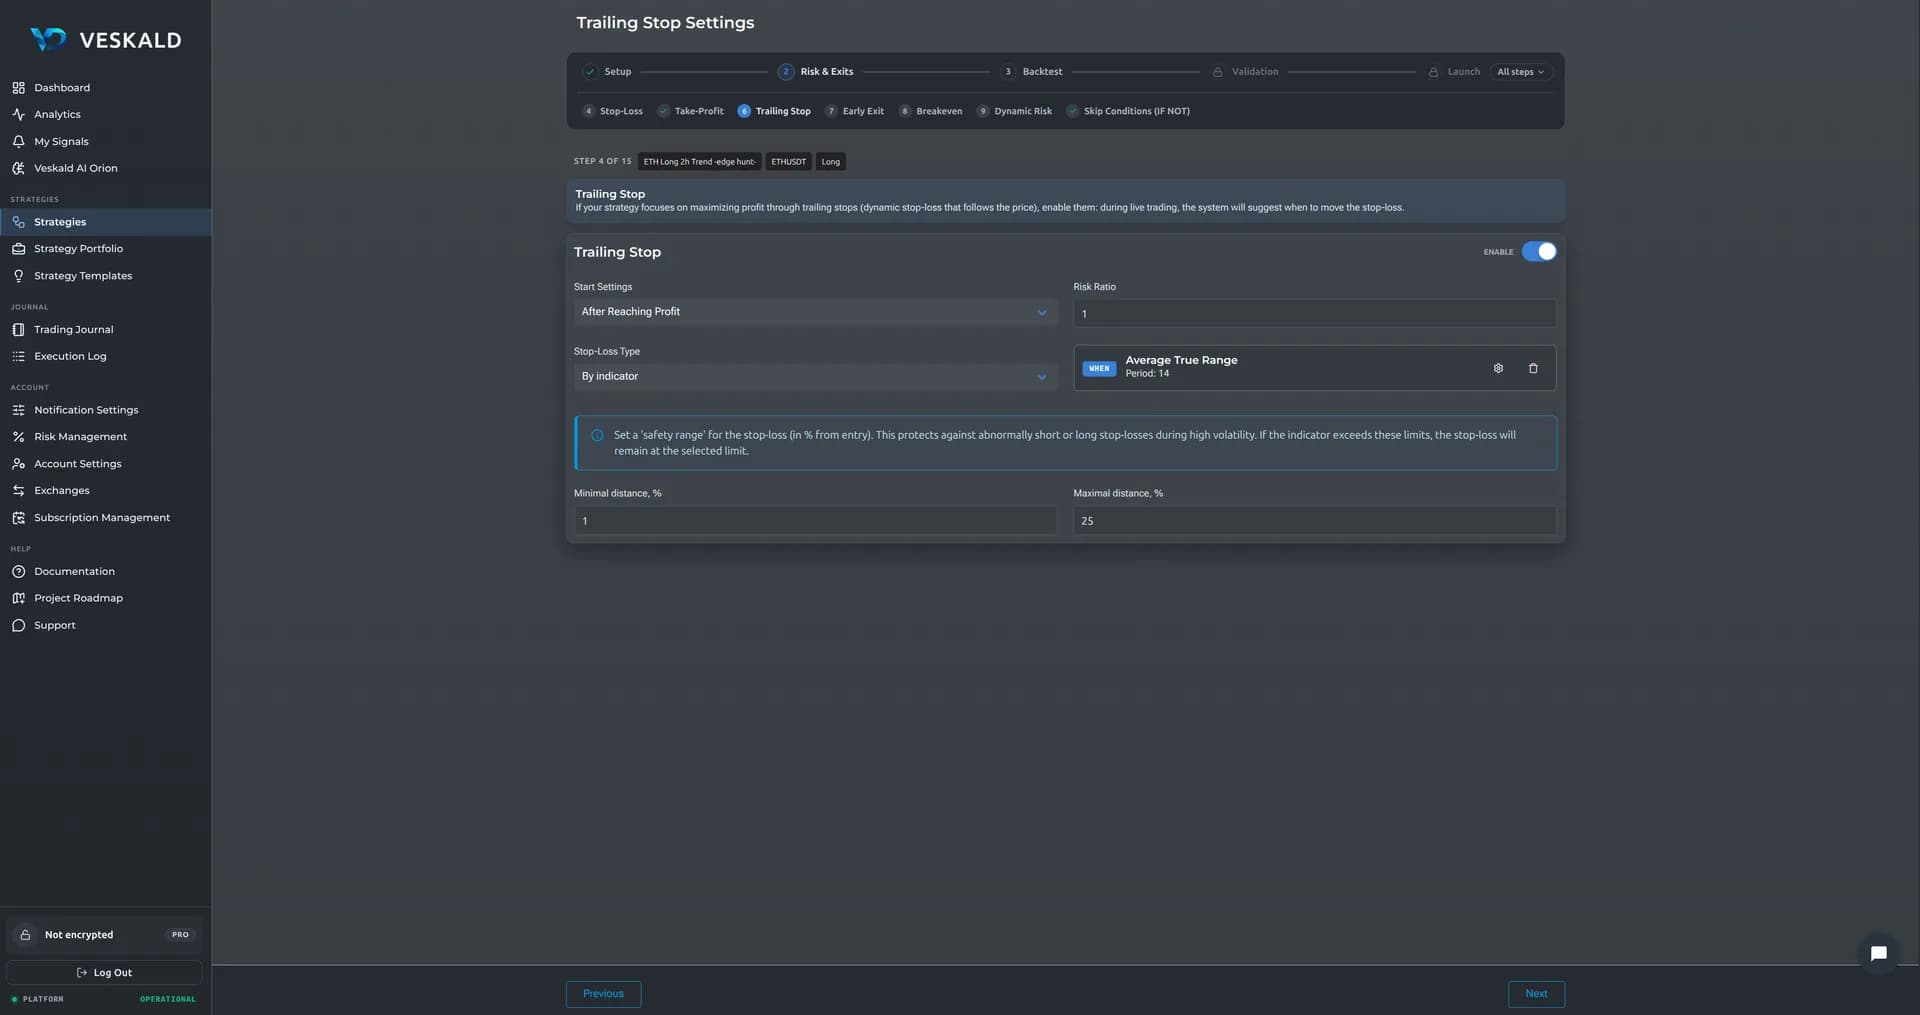
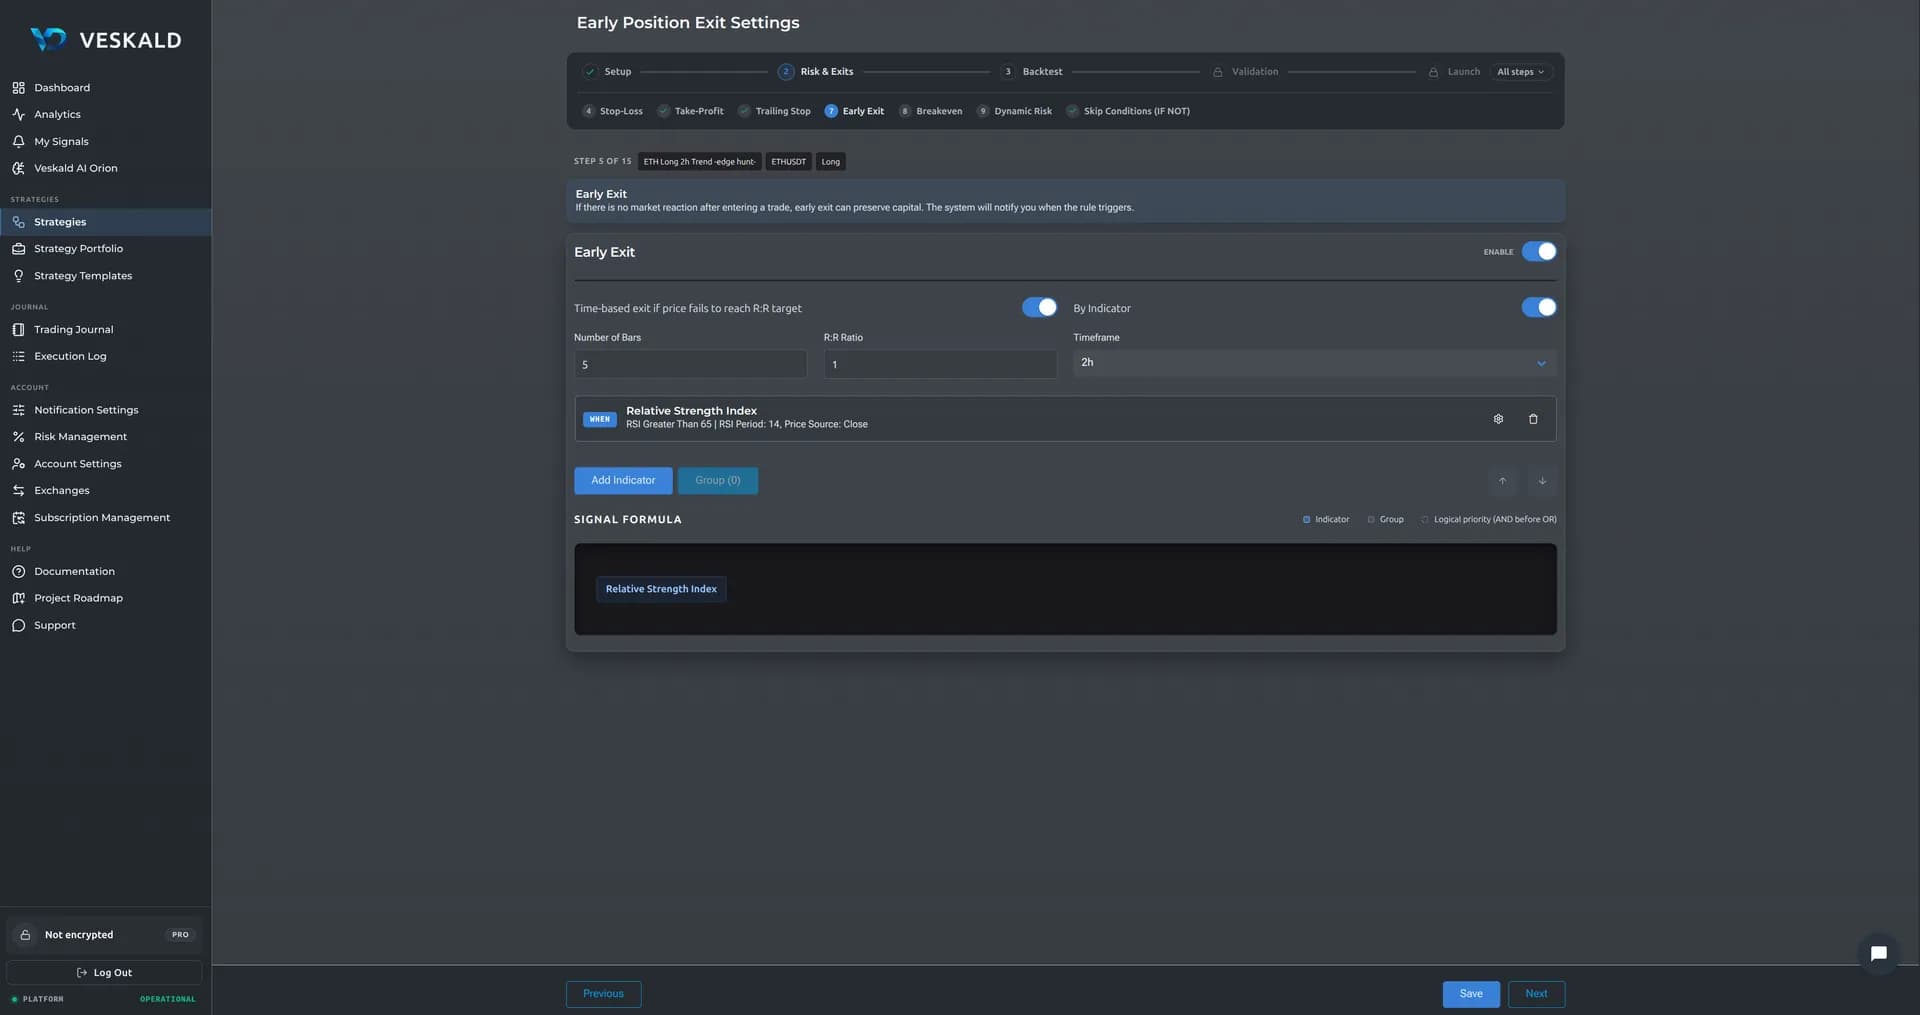
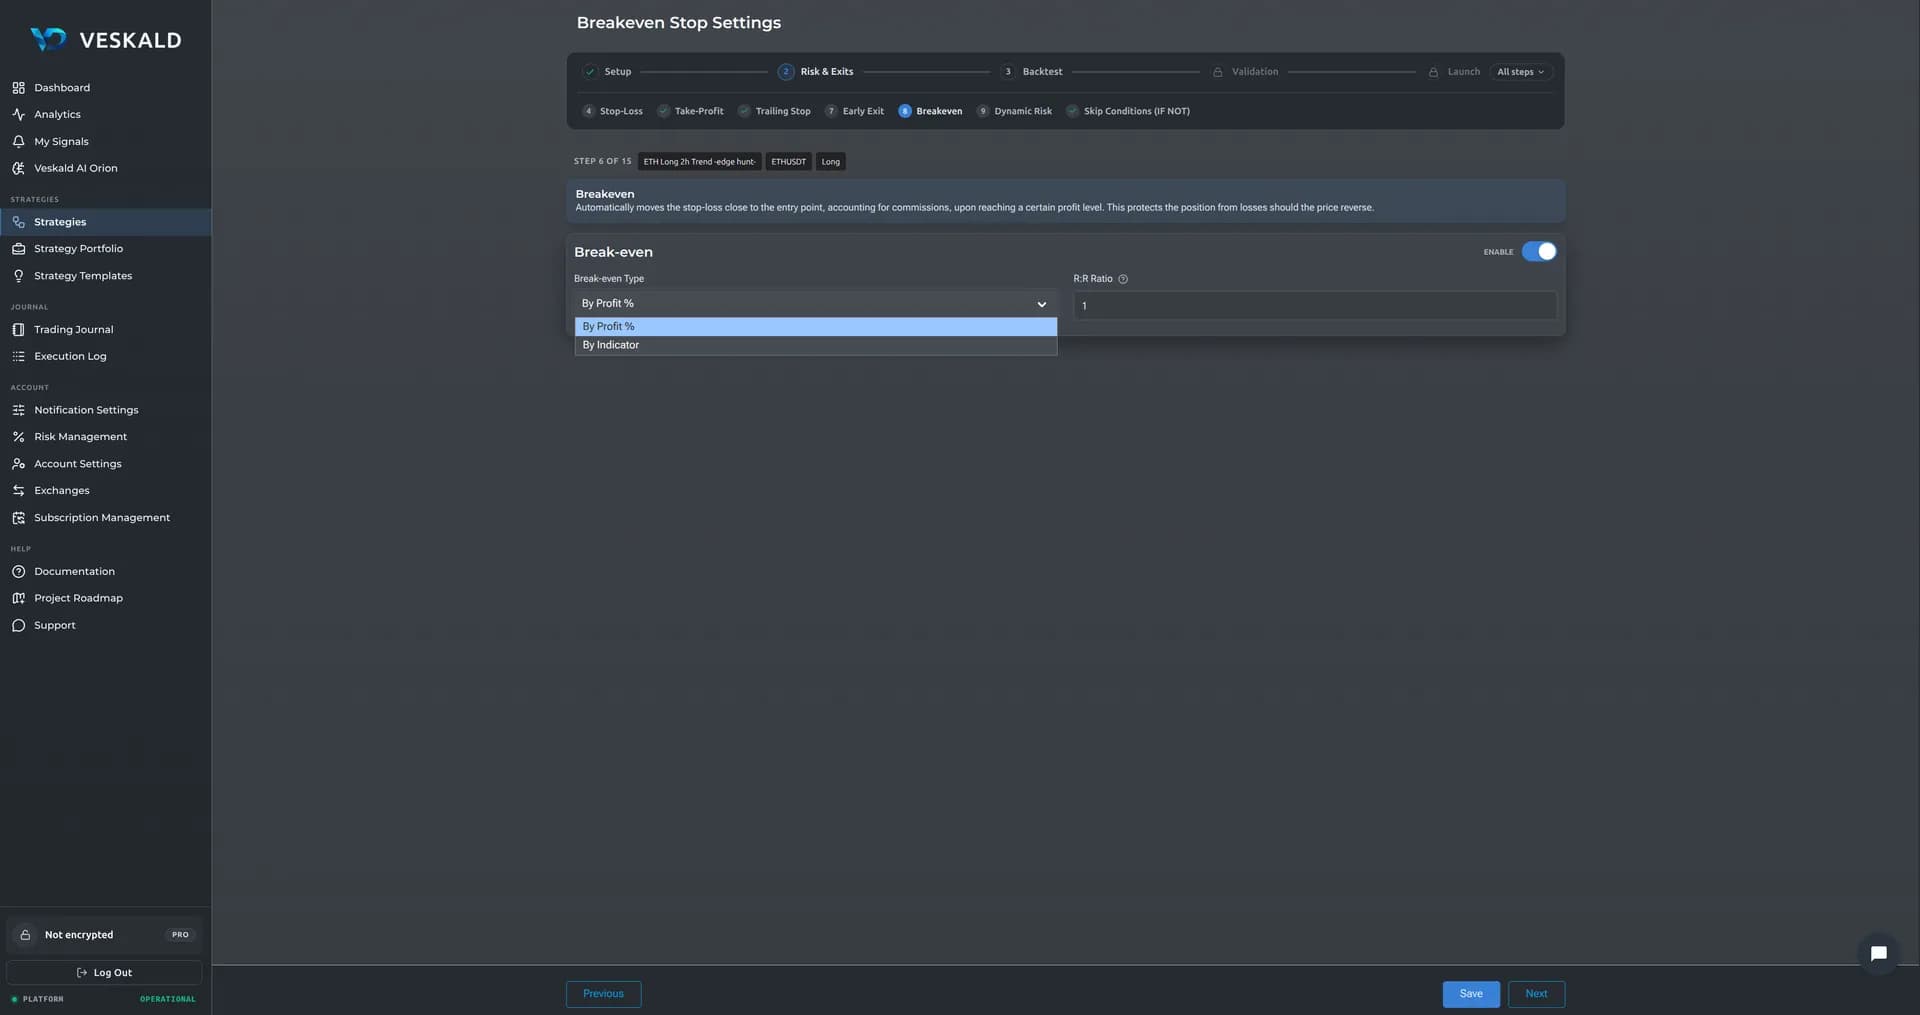
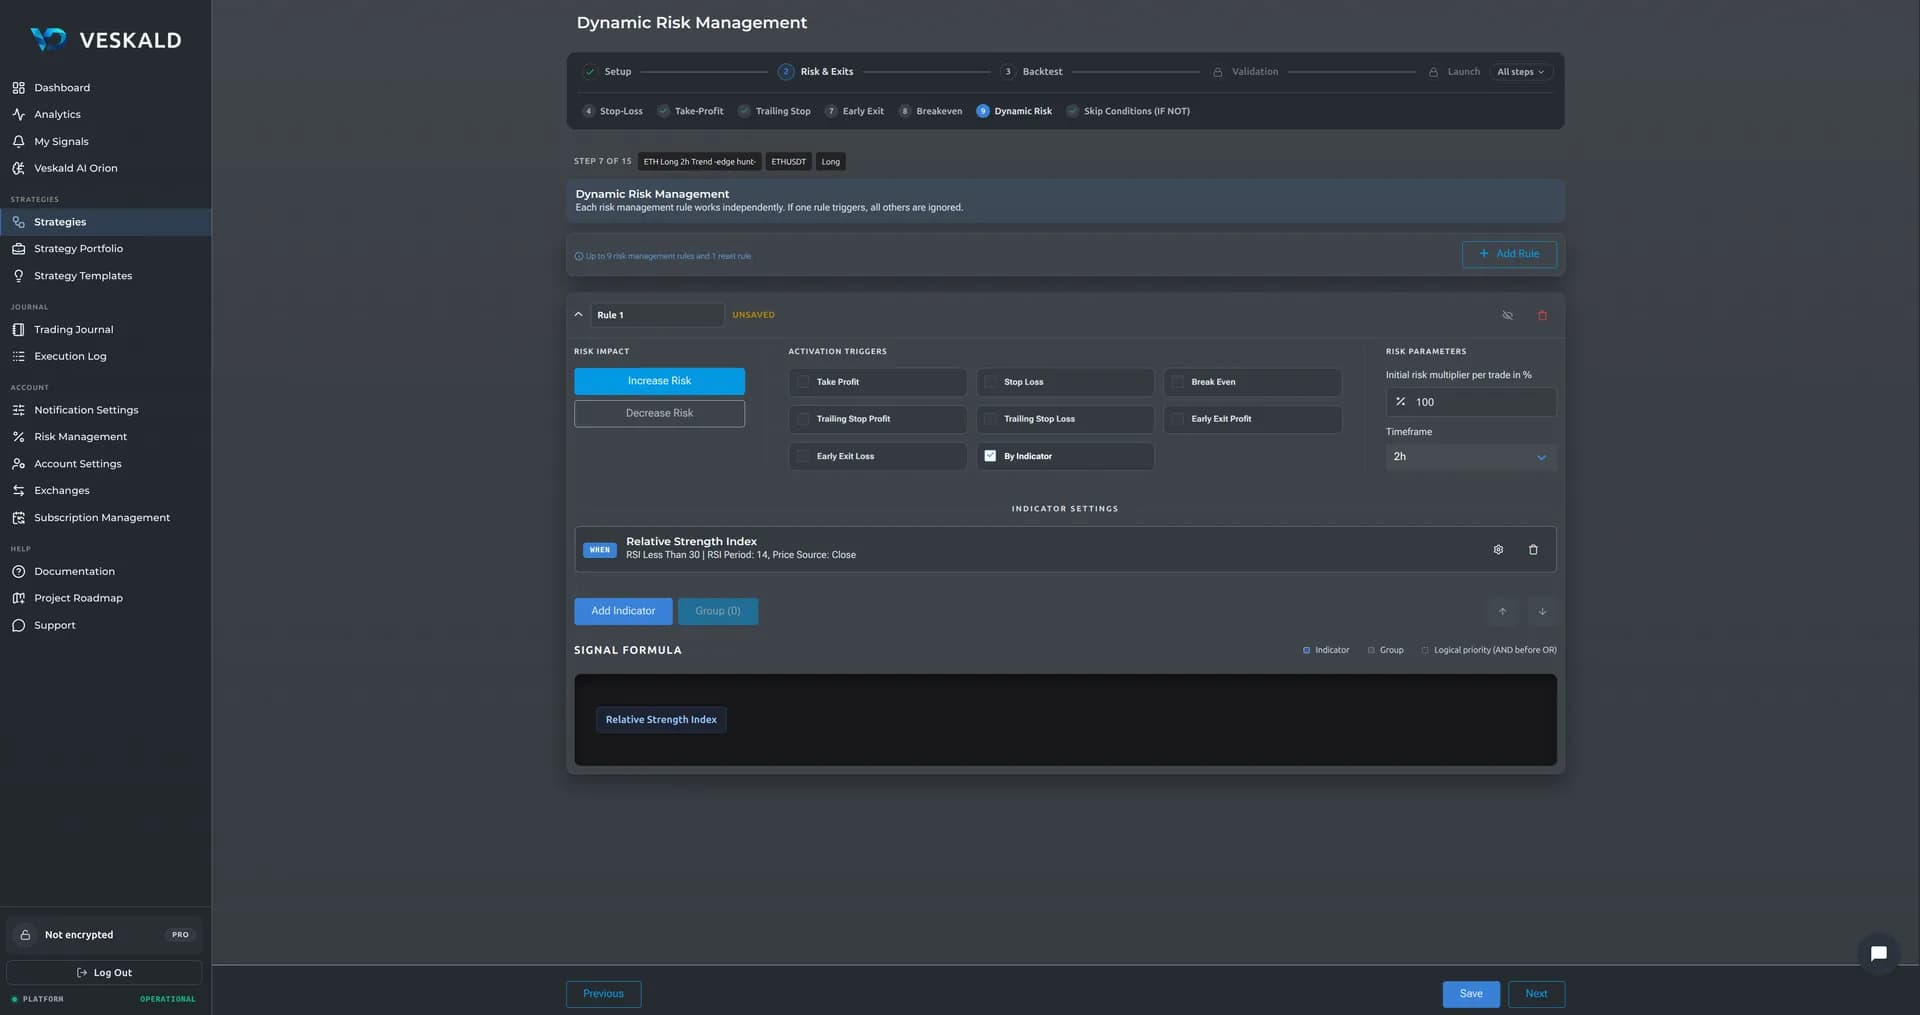
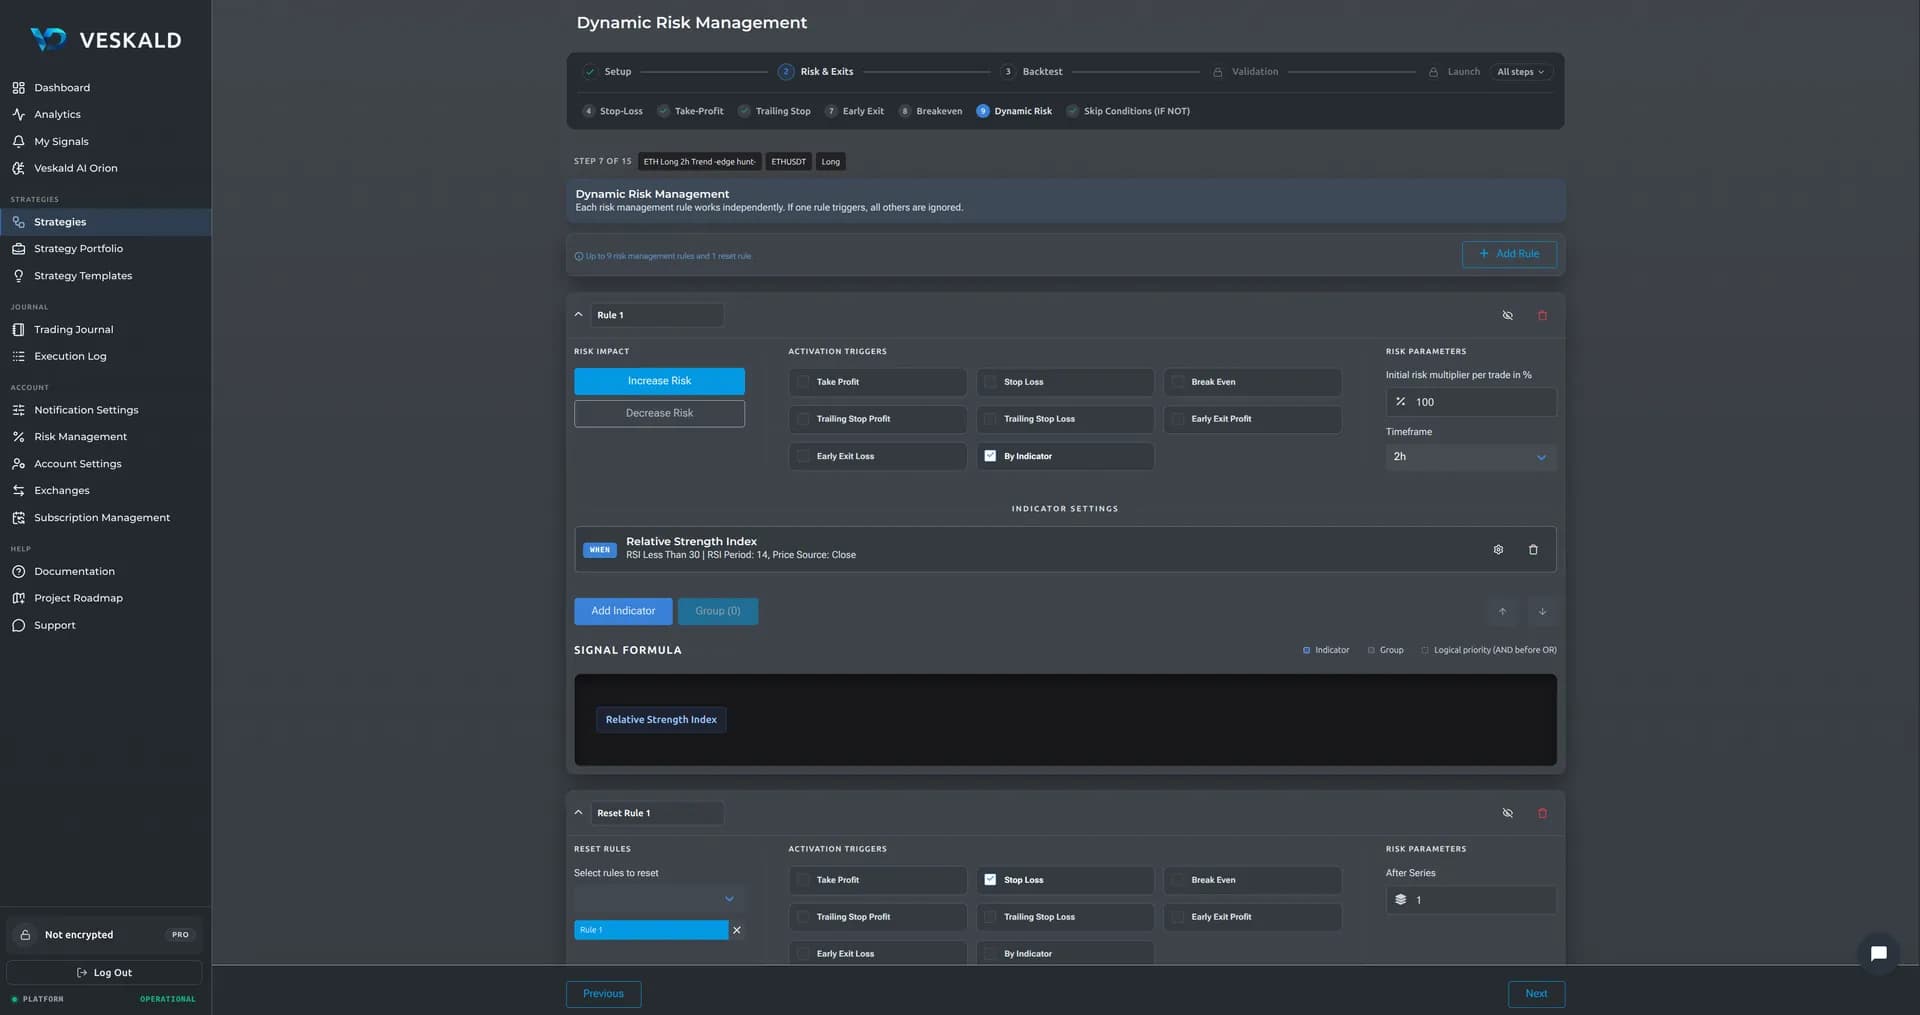
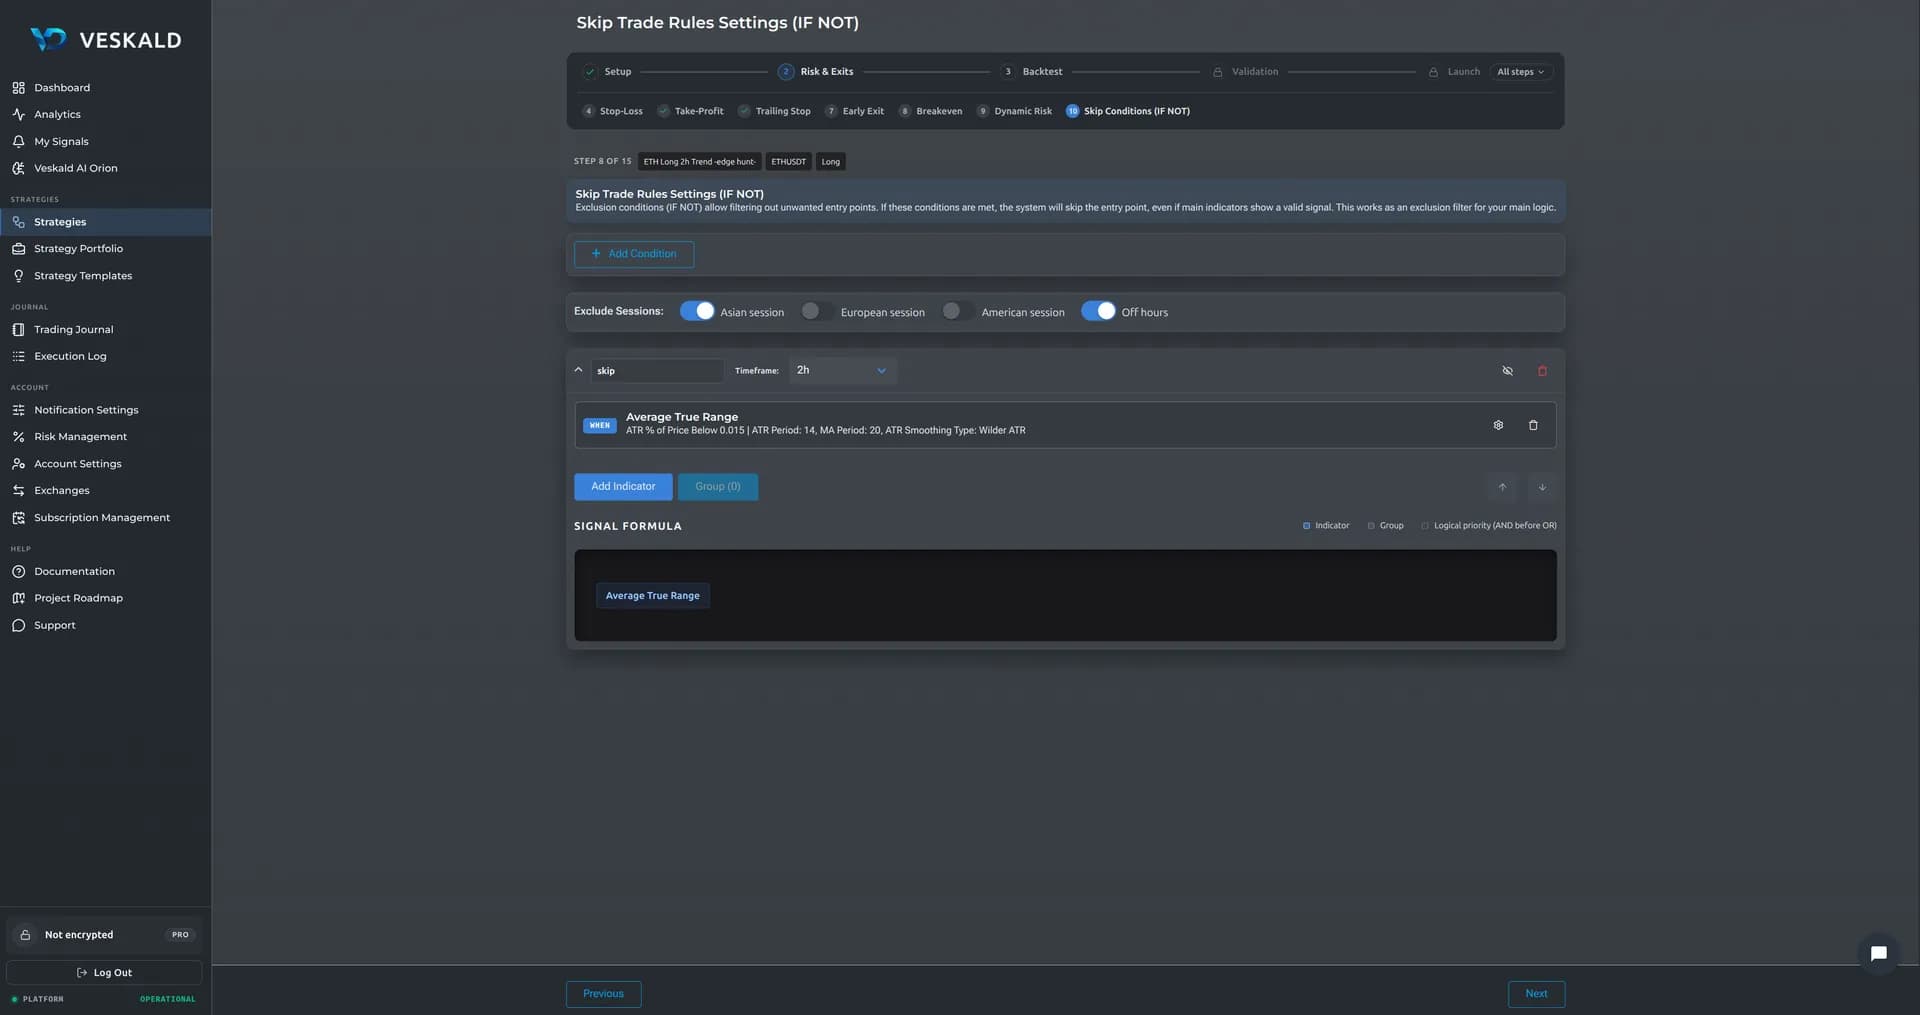
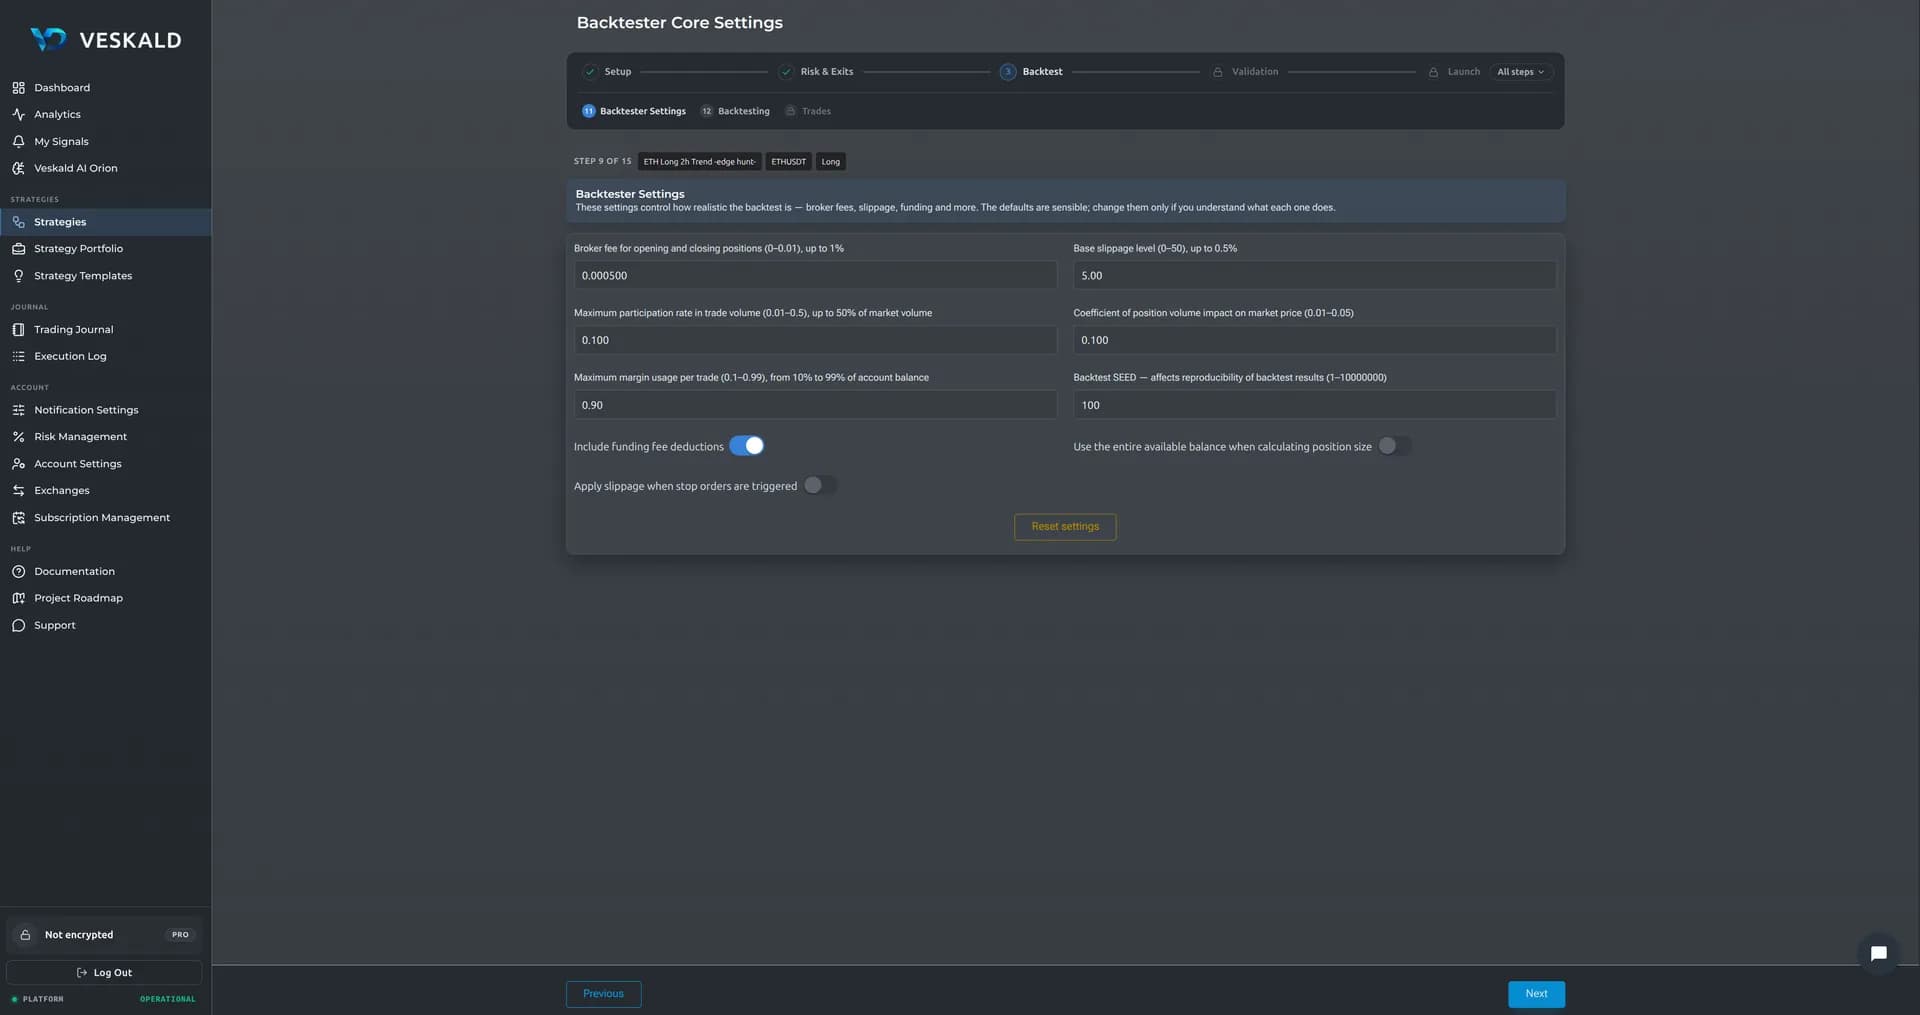
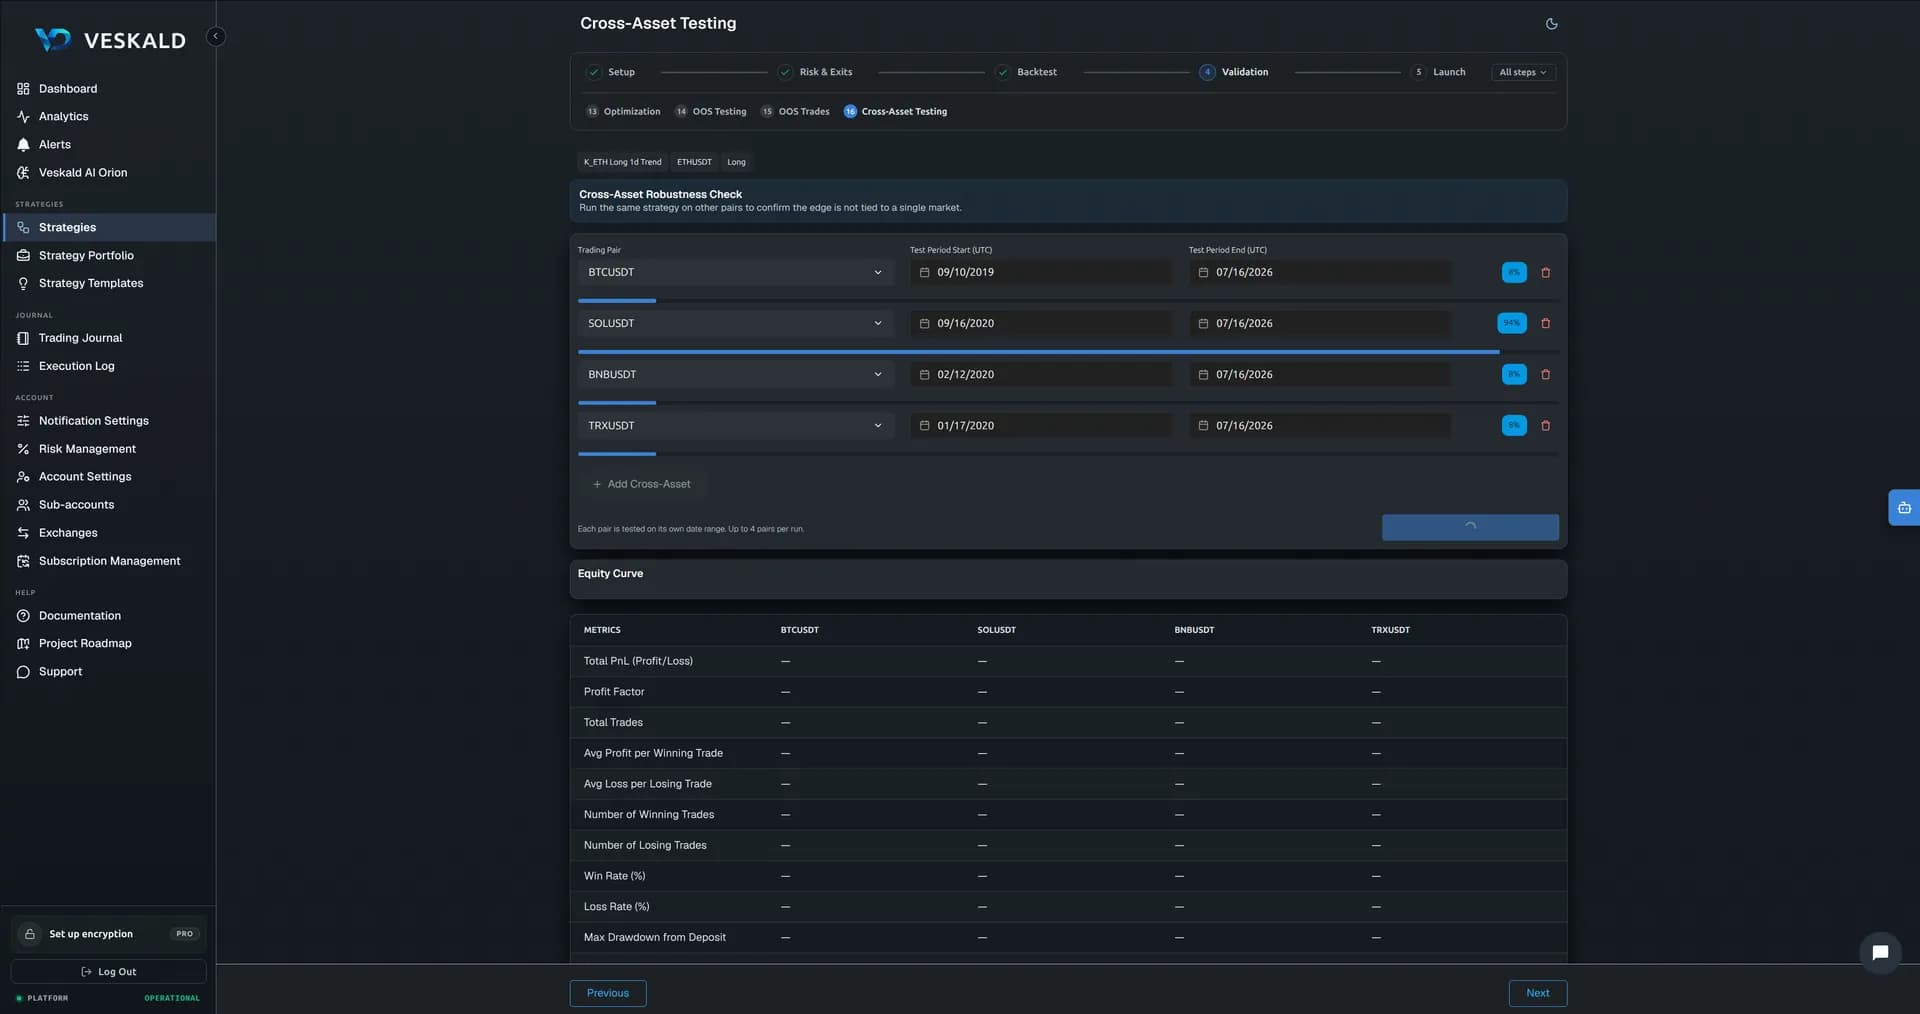
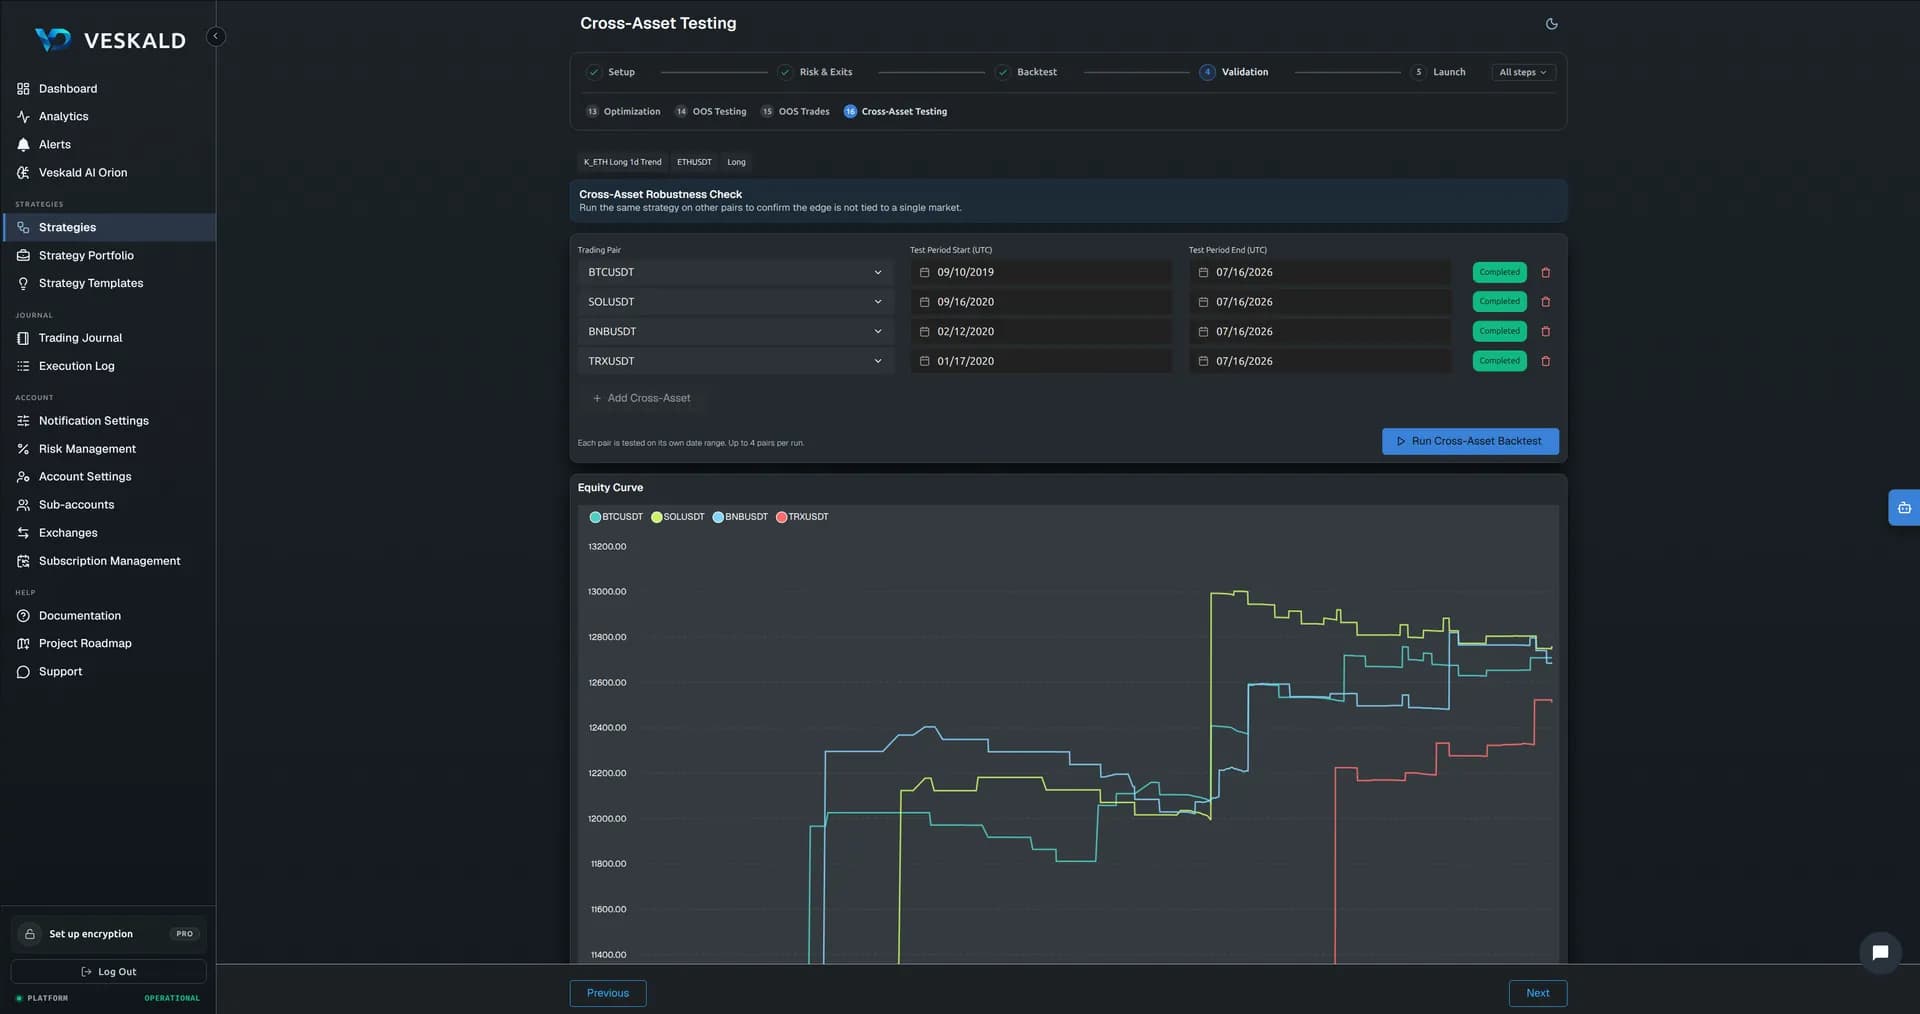
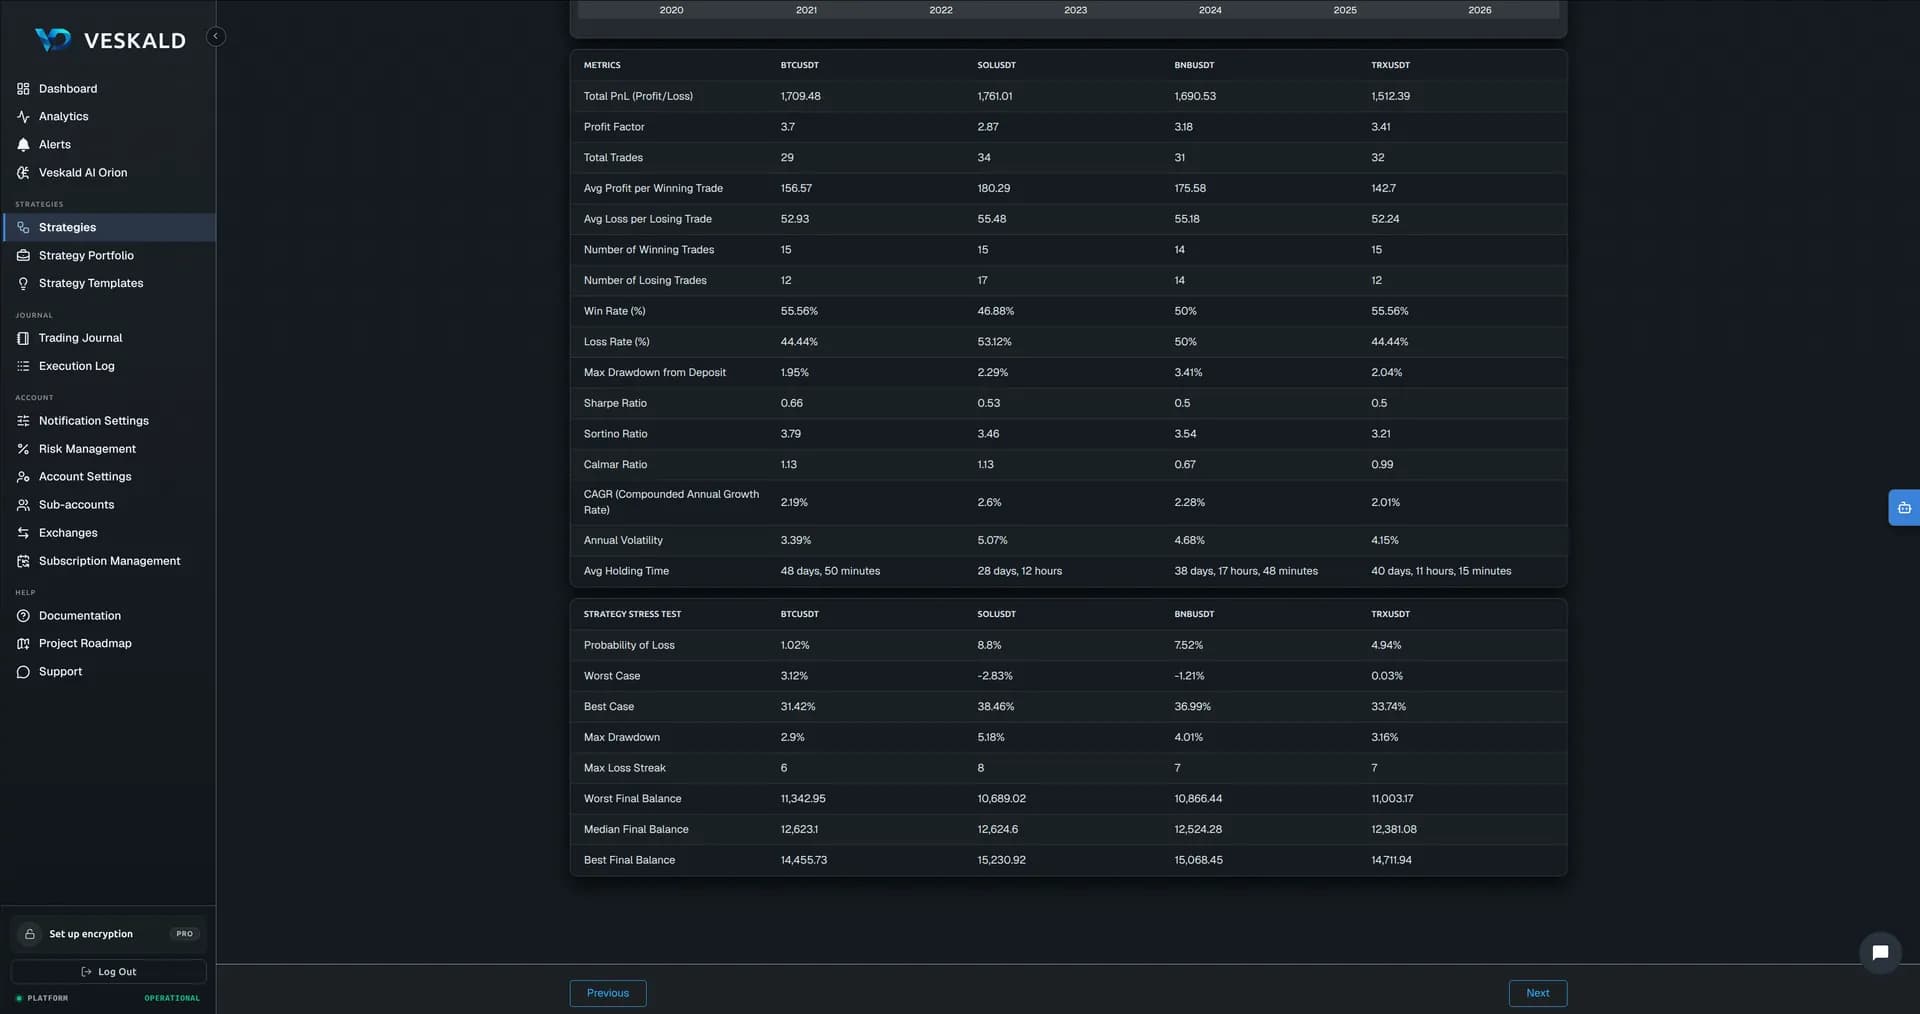
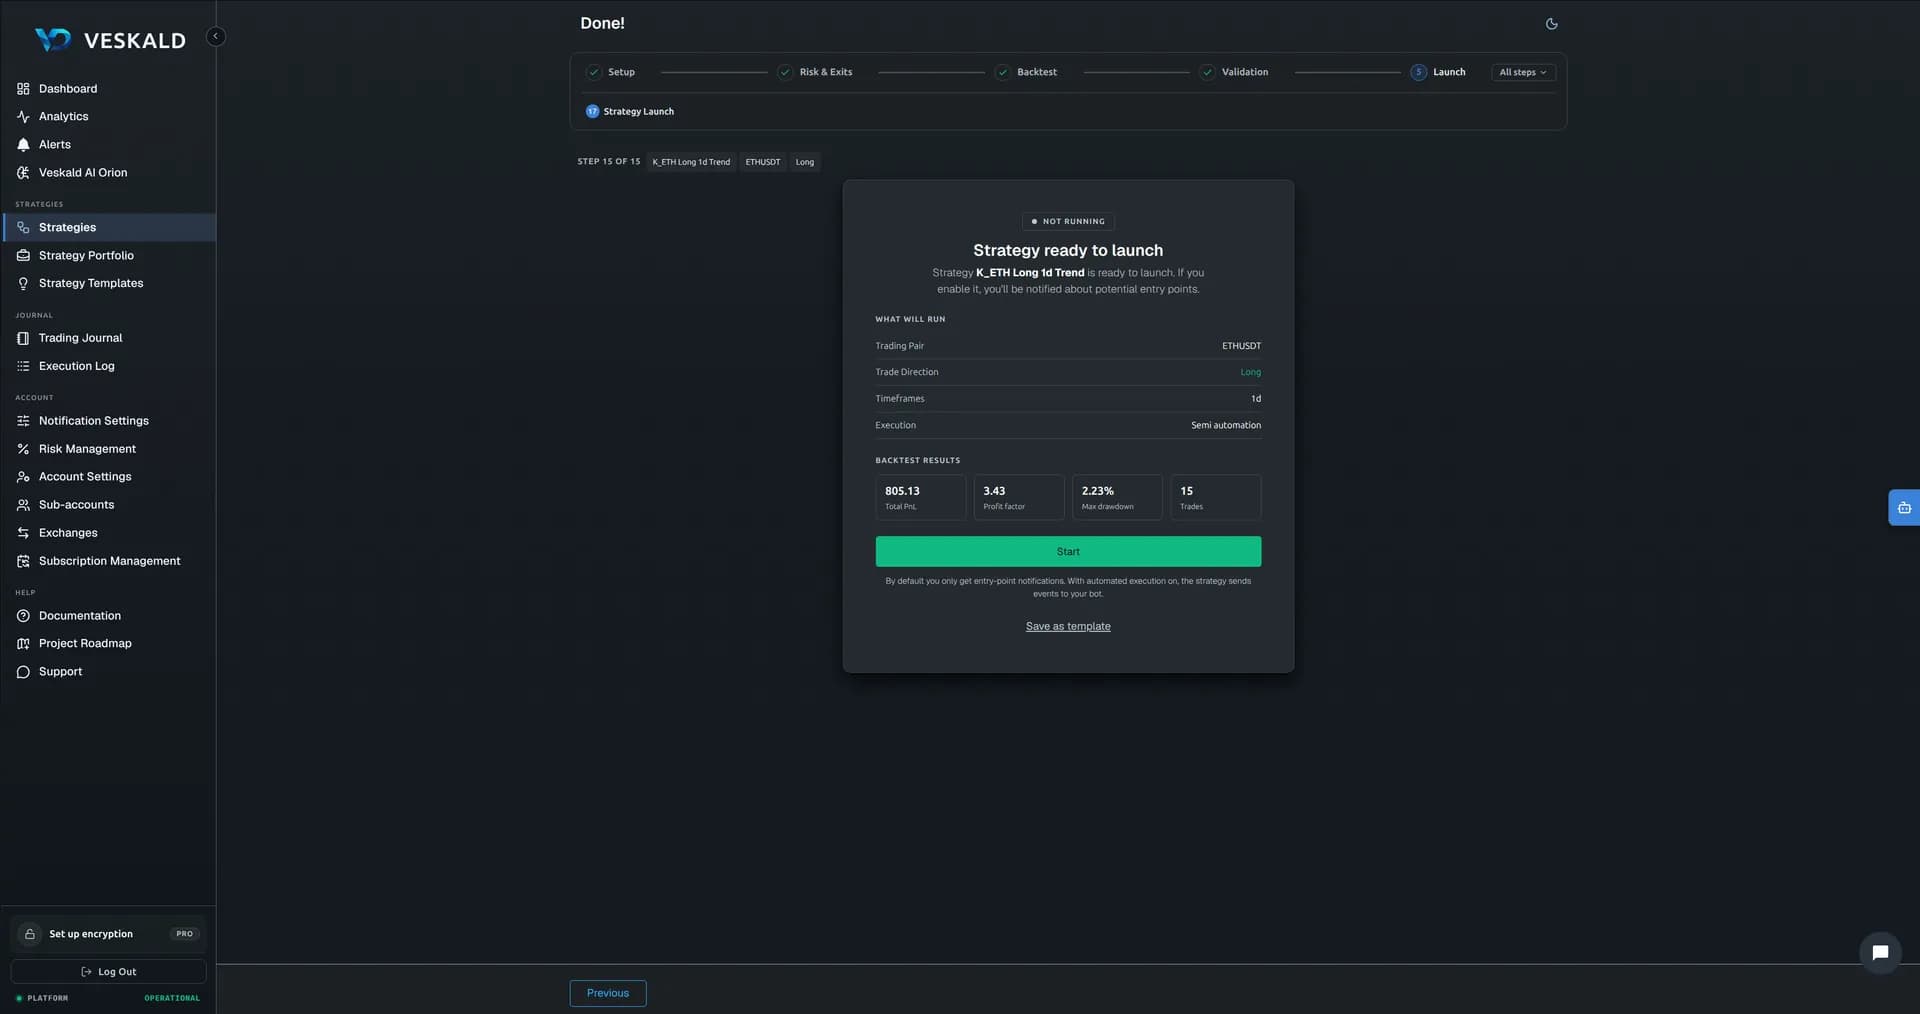
One strategy, every step
Assembled to show every setting of the builder in one place. Not a trading idea, and not a strategy we trade — that is why there is no backtest under it.
- Market
XRPUSDT on Binance — Long
- Entry
Entry conditions are checked on 4h → 1h → 15m
4h — when EMA Less Than Price (EMA Period: 20)
1h — when Volatility Rank Between (Lower Bound: 0.5 · Upper Bound: 0.75) and ATR Ratio Above 110 (Fast Period: 3 · Slow Period: 10) and TRIX Less Than Zero (TRIX Period: 15) and Squeeze Index Greater Than 2
15m — when RSI Rising for N Bars and RSI Crosses Above RSI MA and RSI Greater Than RSI MA
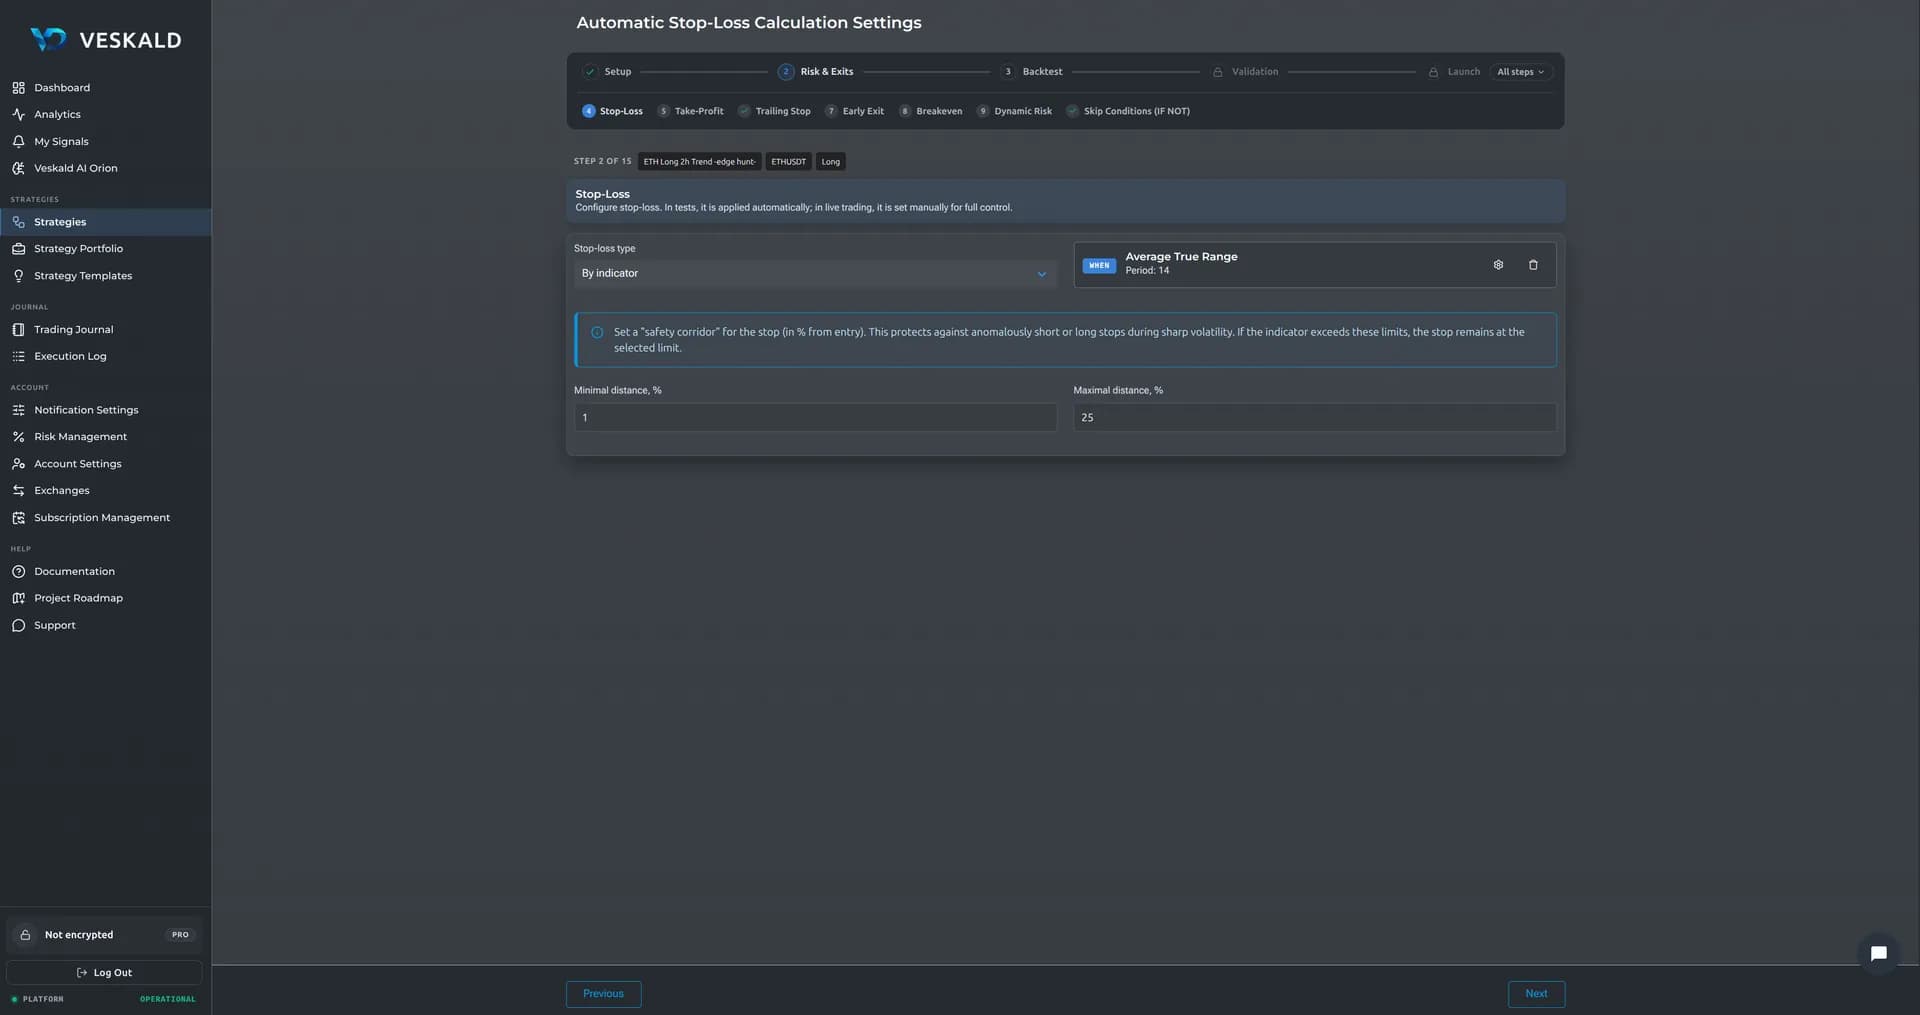
- Stop-loss
By indicator: Average True Range (Period: 14)
Distance: no closer than 0.5% and no farther than 25% from the entry
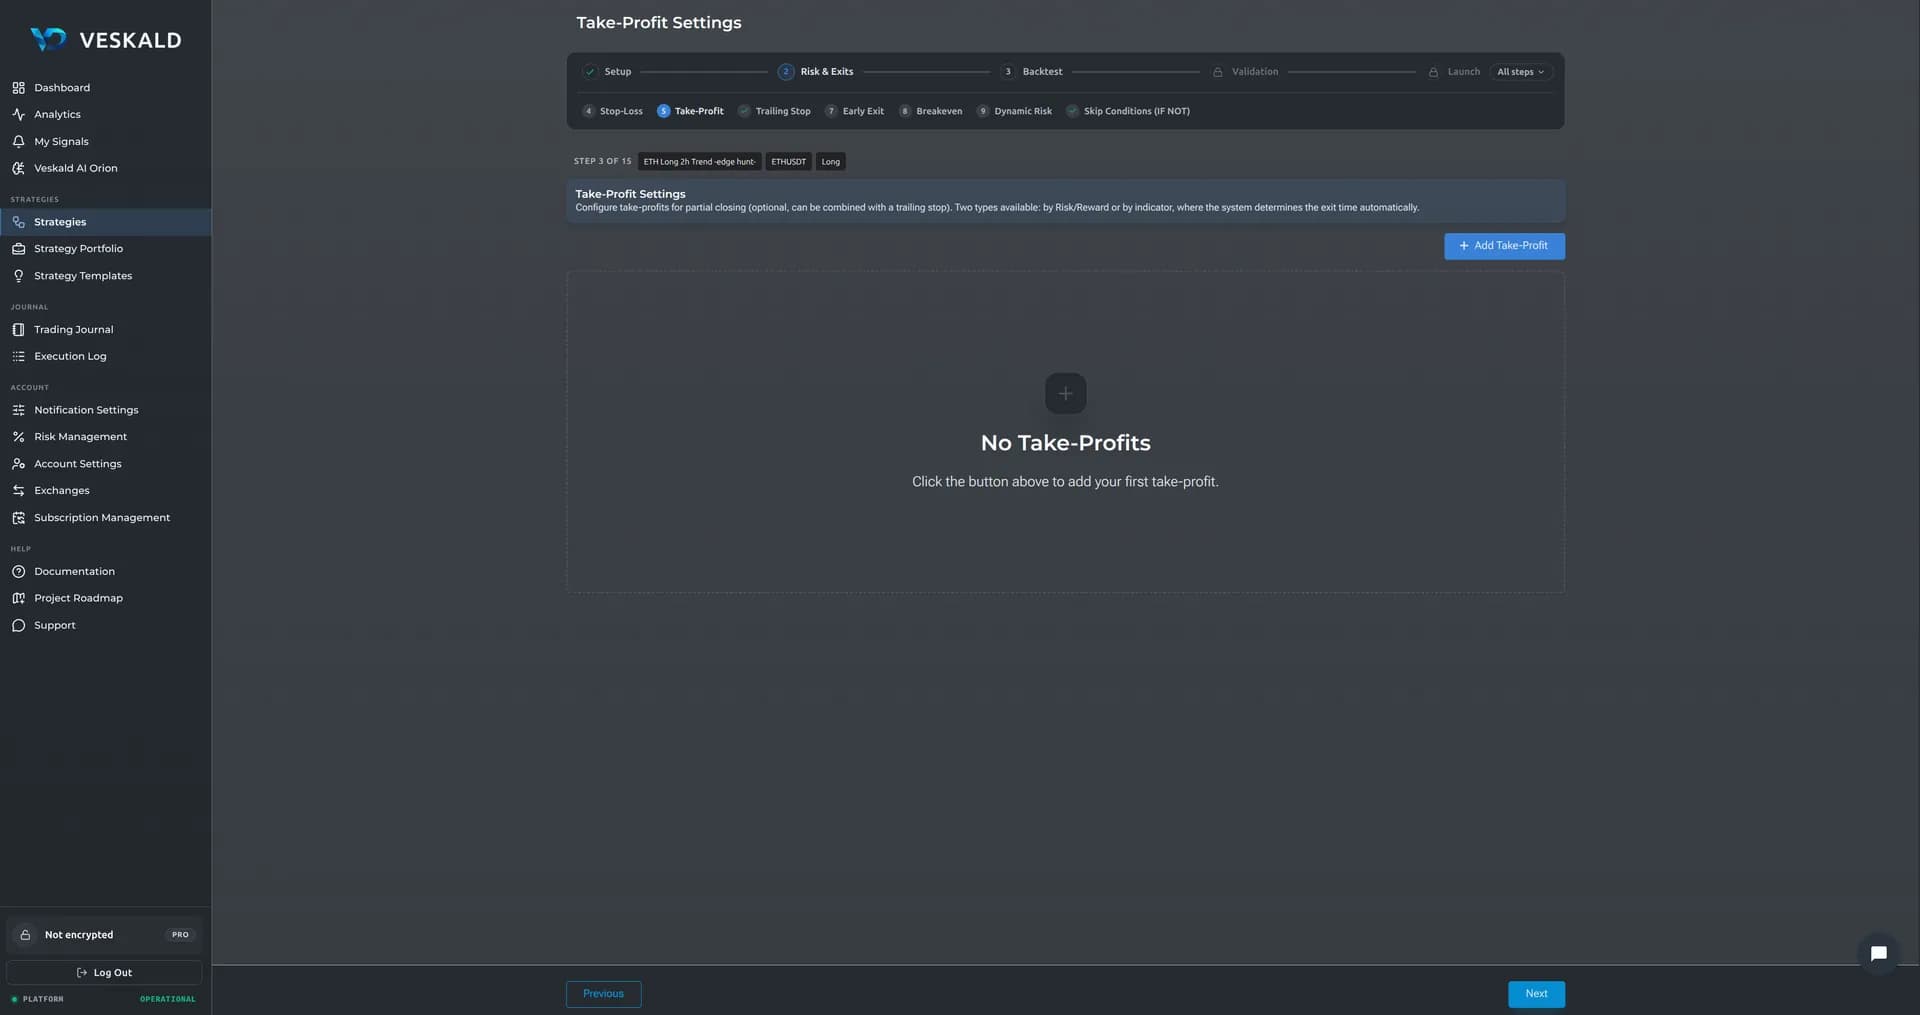
- Take-profits
Level 1: at 1:1, 25% of the position is taken
Level 2: by indicator on 1h (RSI Falling for N Bars), 50% of the position is taken
- Trailing stop
Turns on once profit reaches 1:1
The stop follows an indicator: Average True Range (Period: 14)
Distance: no closer than 0.5% and no farther than 25% from the entry
- Break-even
The stop moves to break-even by indicator on 1h: CHOP Momentum Less Than 30
- Early exit
Exit if the 1:1 target is not reached within 10 candles
Exit by indicator on 1h: CMO Greater Than 40 (CMO Period: 14 · MA Type: EMA)
- Skip trades
No new entries: Asian session
Skip Rule 1: by indicator on 1h — AD Cross Below AD Percentile (Percentile Value: 0.1 · Percentile Period: 50)
- Dynamic risk
Rule 1: the per-trade risk increases by 10% when the indicator on 1h fires — ATR (Absolute) Cross Above Smoothed ATR (MA Type: EMA · Statistics Window: 10)
Reset Rule 1: back to the initial risk after Stop Loss, Trailing Stop Profit, Early Exit Loss, Take Profit, Trailing Stop Loss, Early Exit Profit, Break Even
- Execution
Semi automation — you get alerts about entry points and place orders yourself
Generated by the platform from the strategy’s own settings, shown as produced.
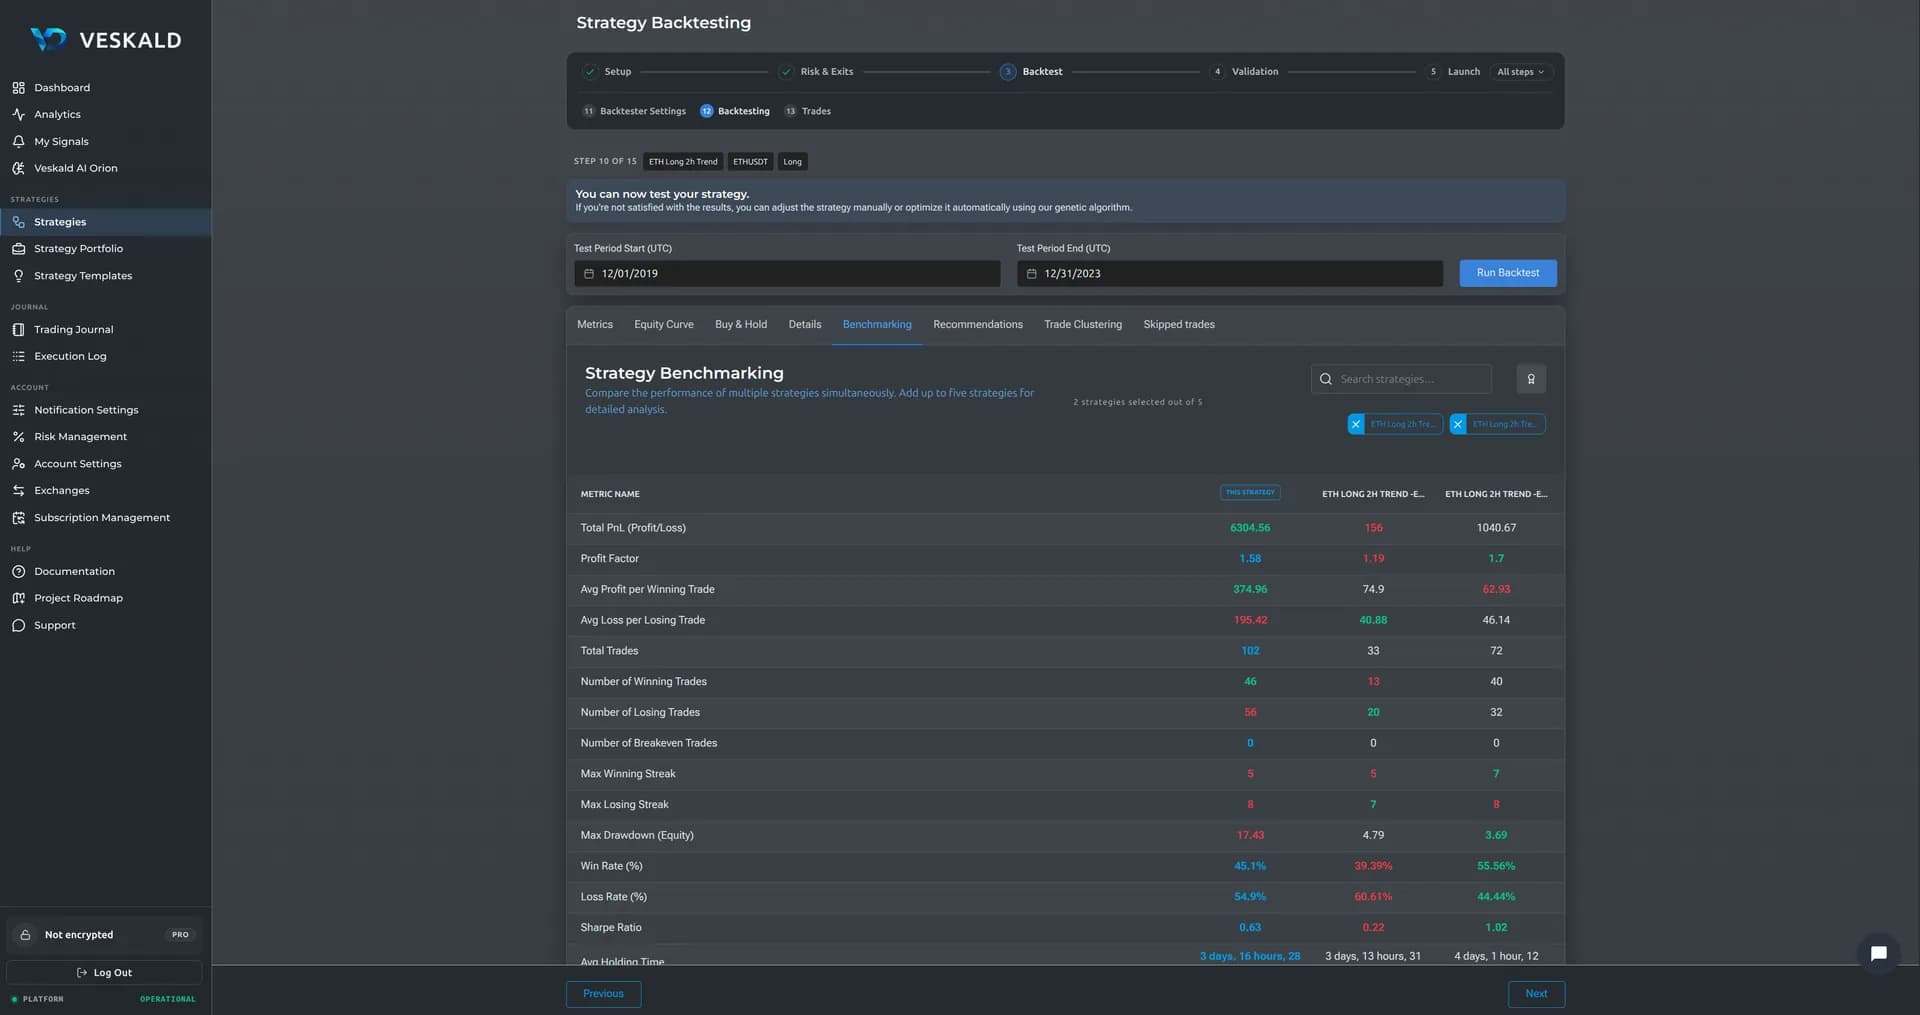
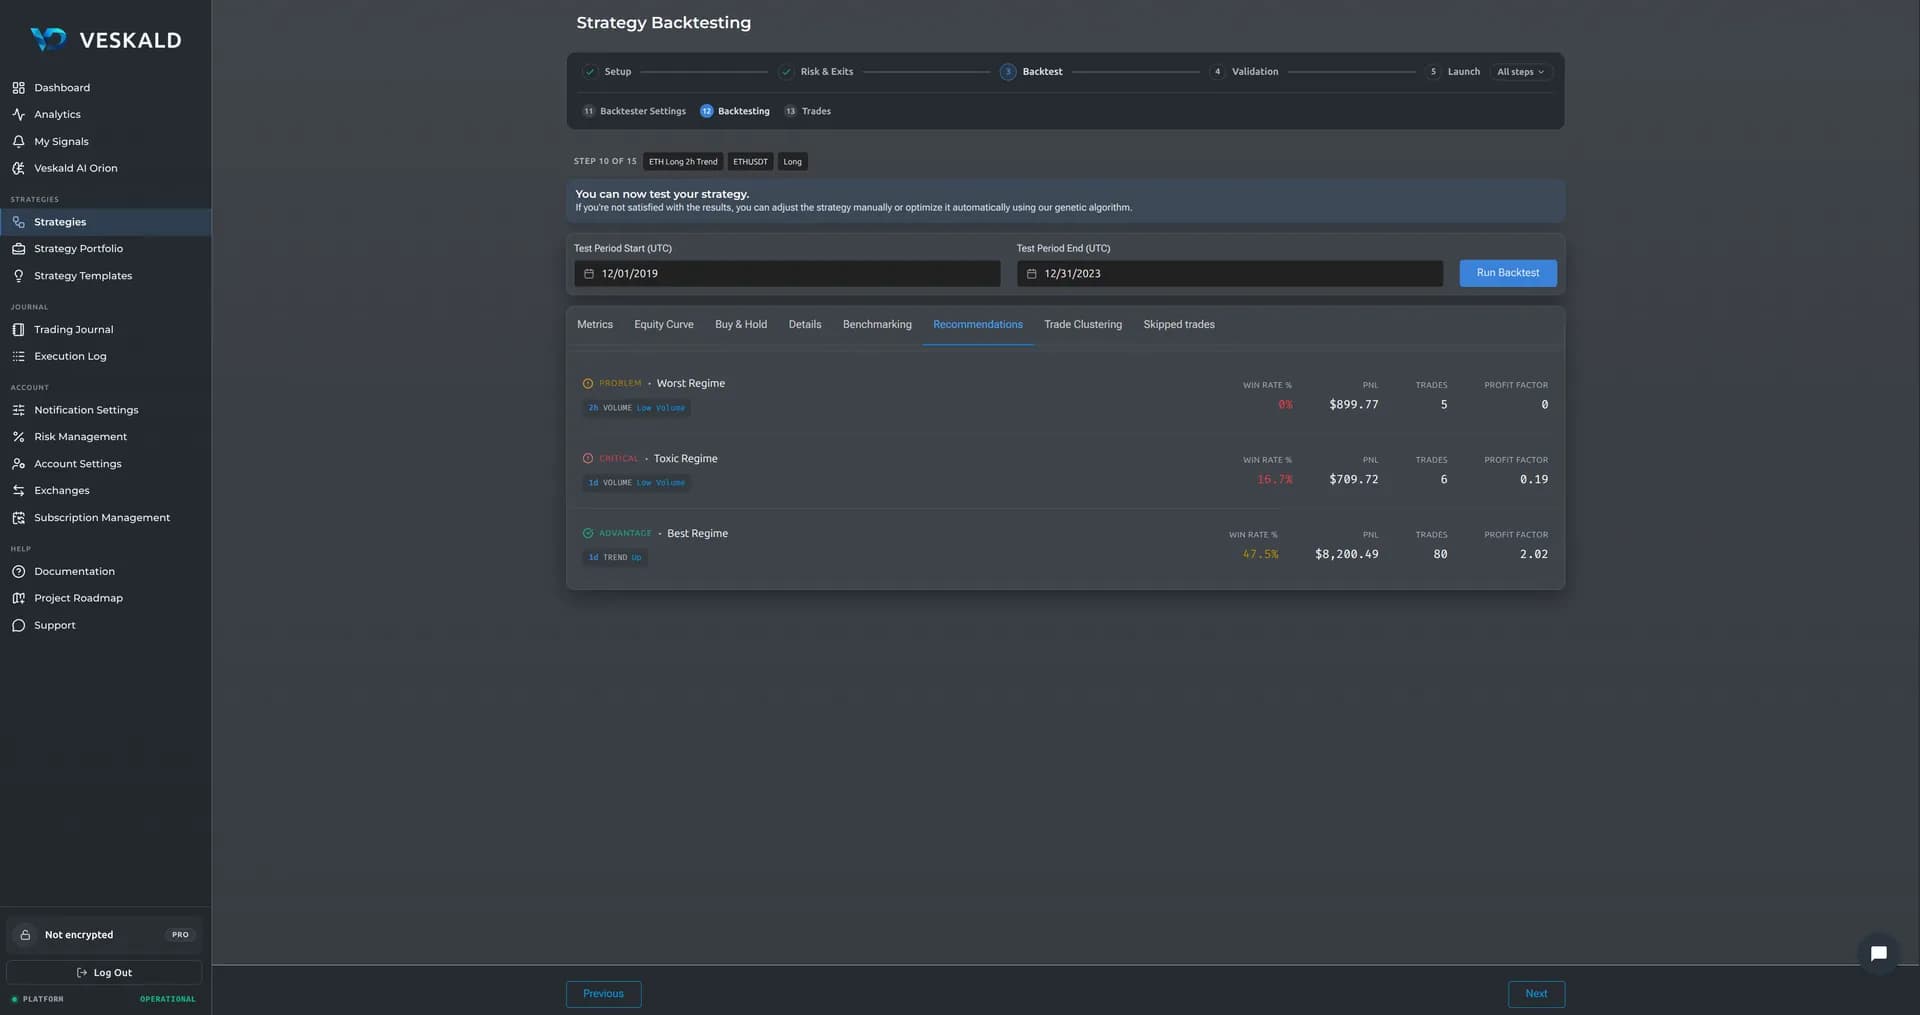
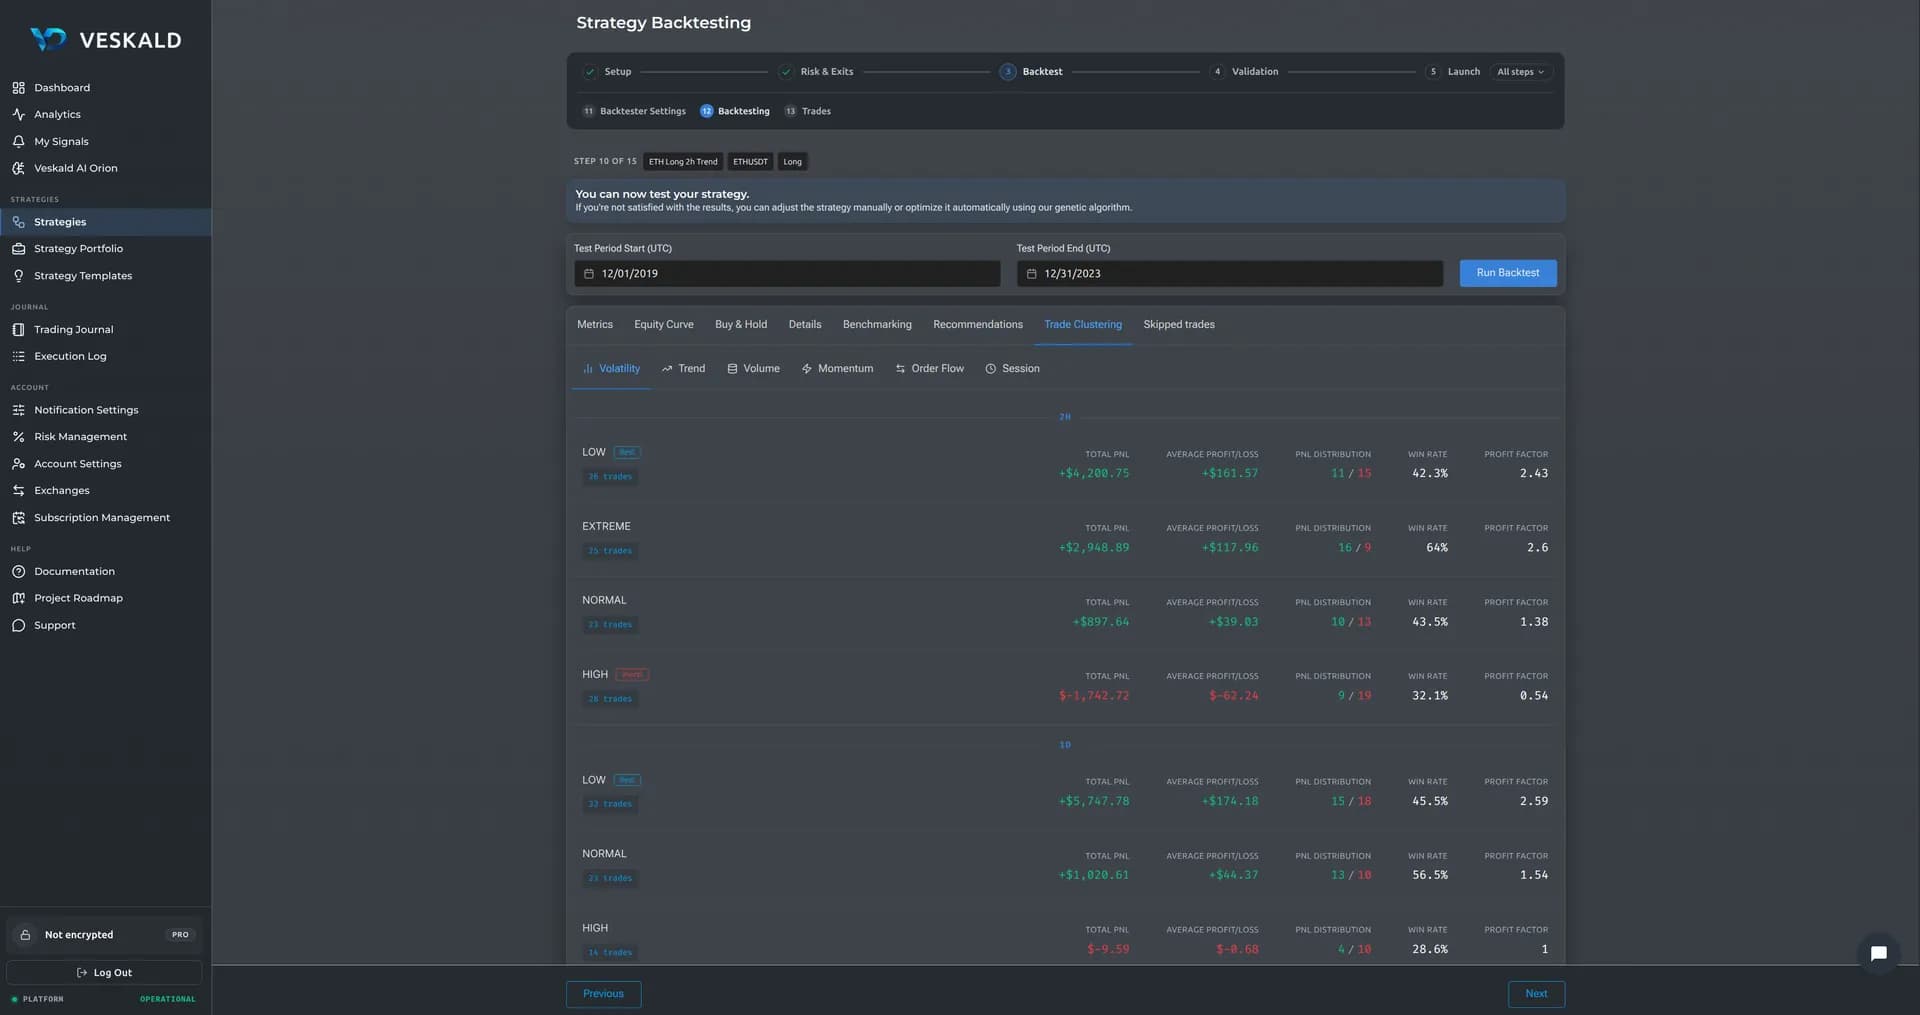
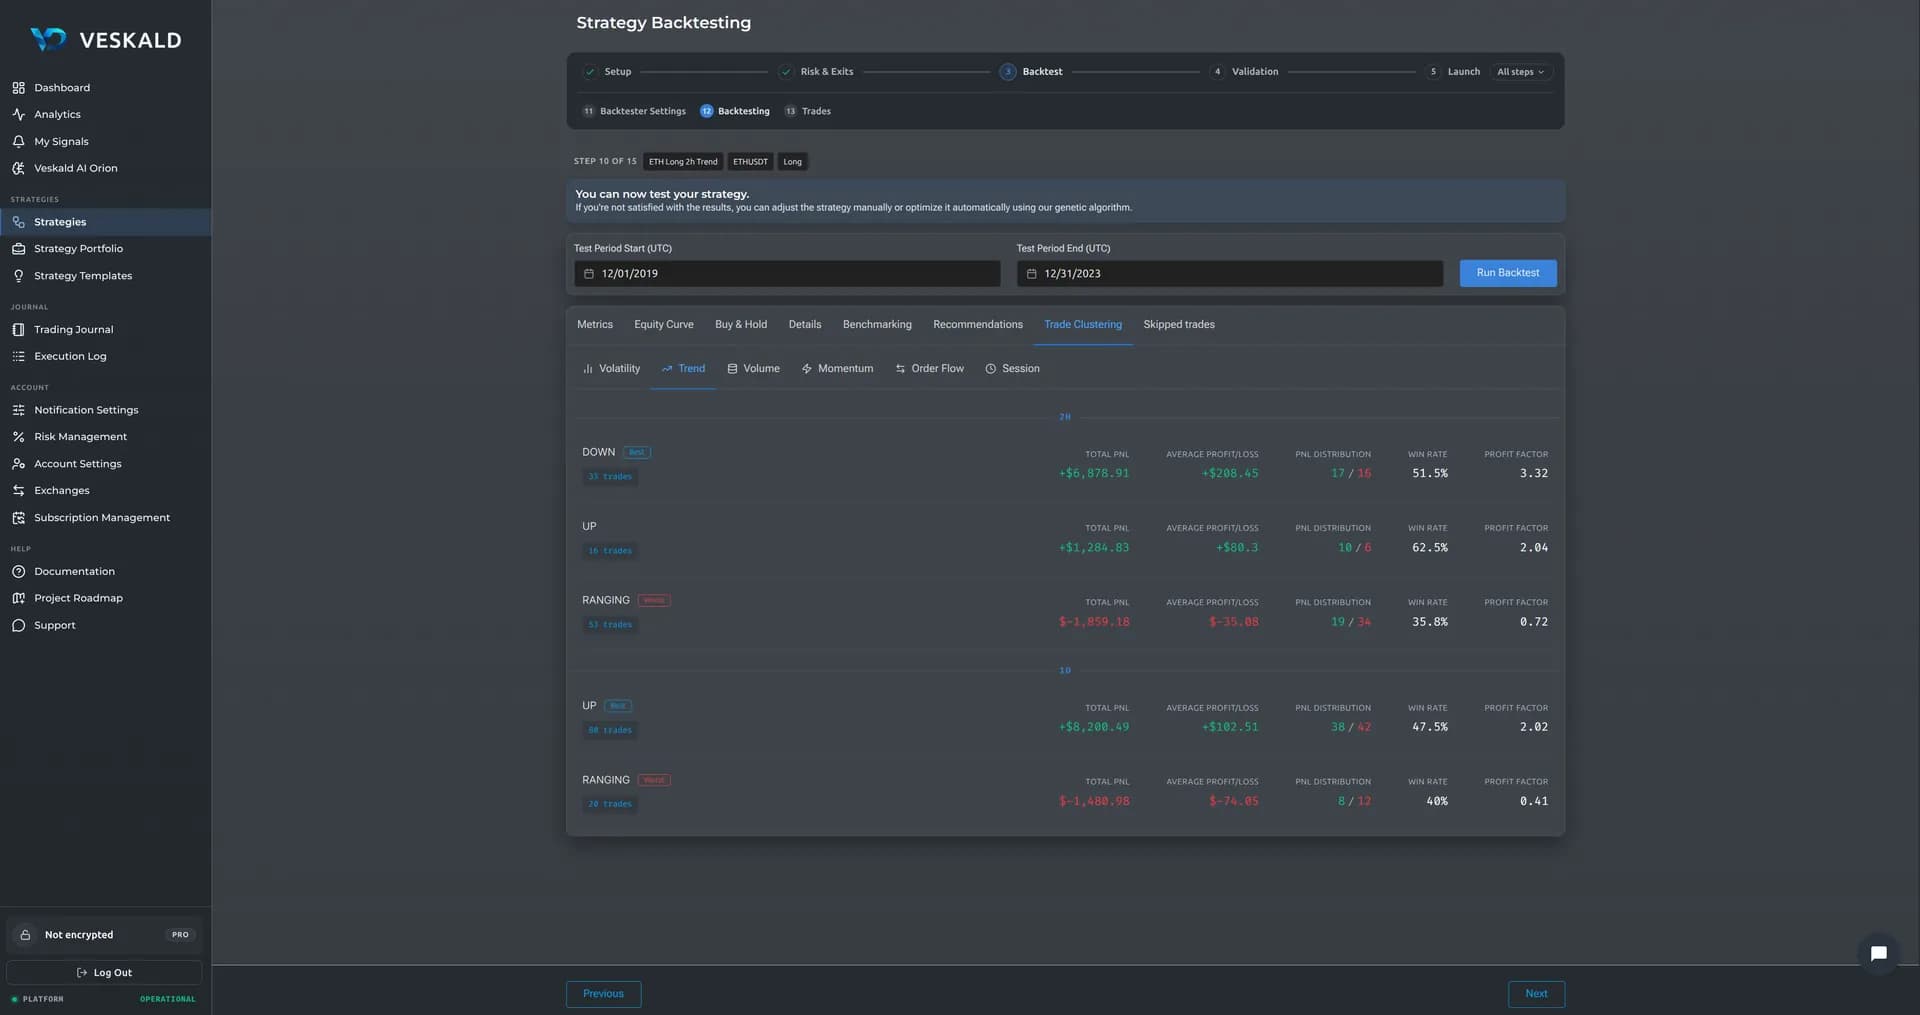
Backtester
A backtest that shows you what you will actually get
Most backtesters paint an ideal picture: no commissions, no slippage, no funding. The strategy looks beautiful on history and bleeds in live trading.
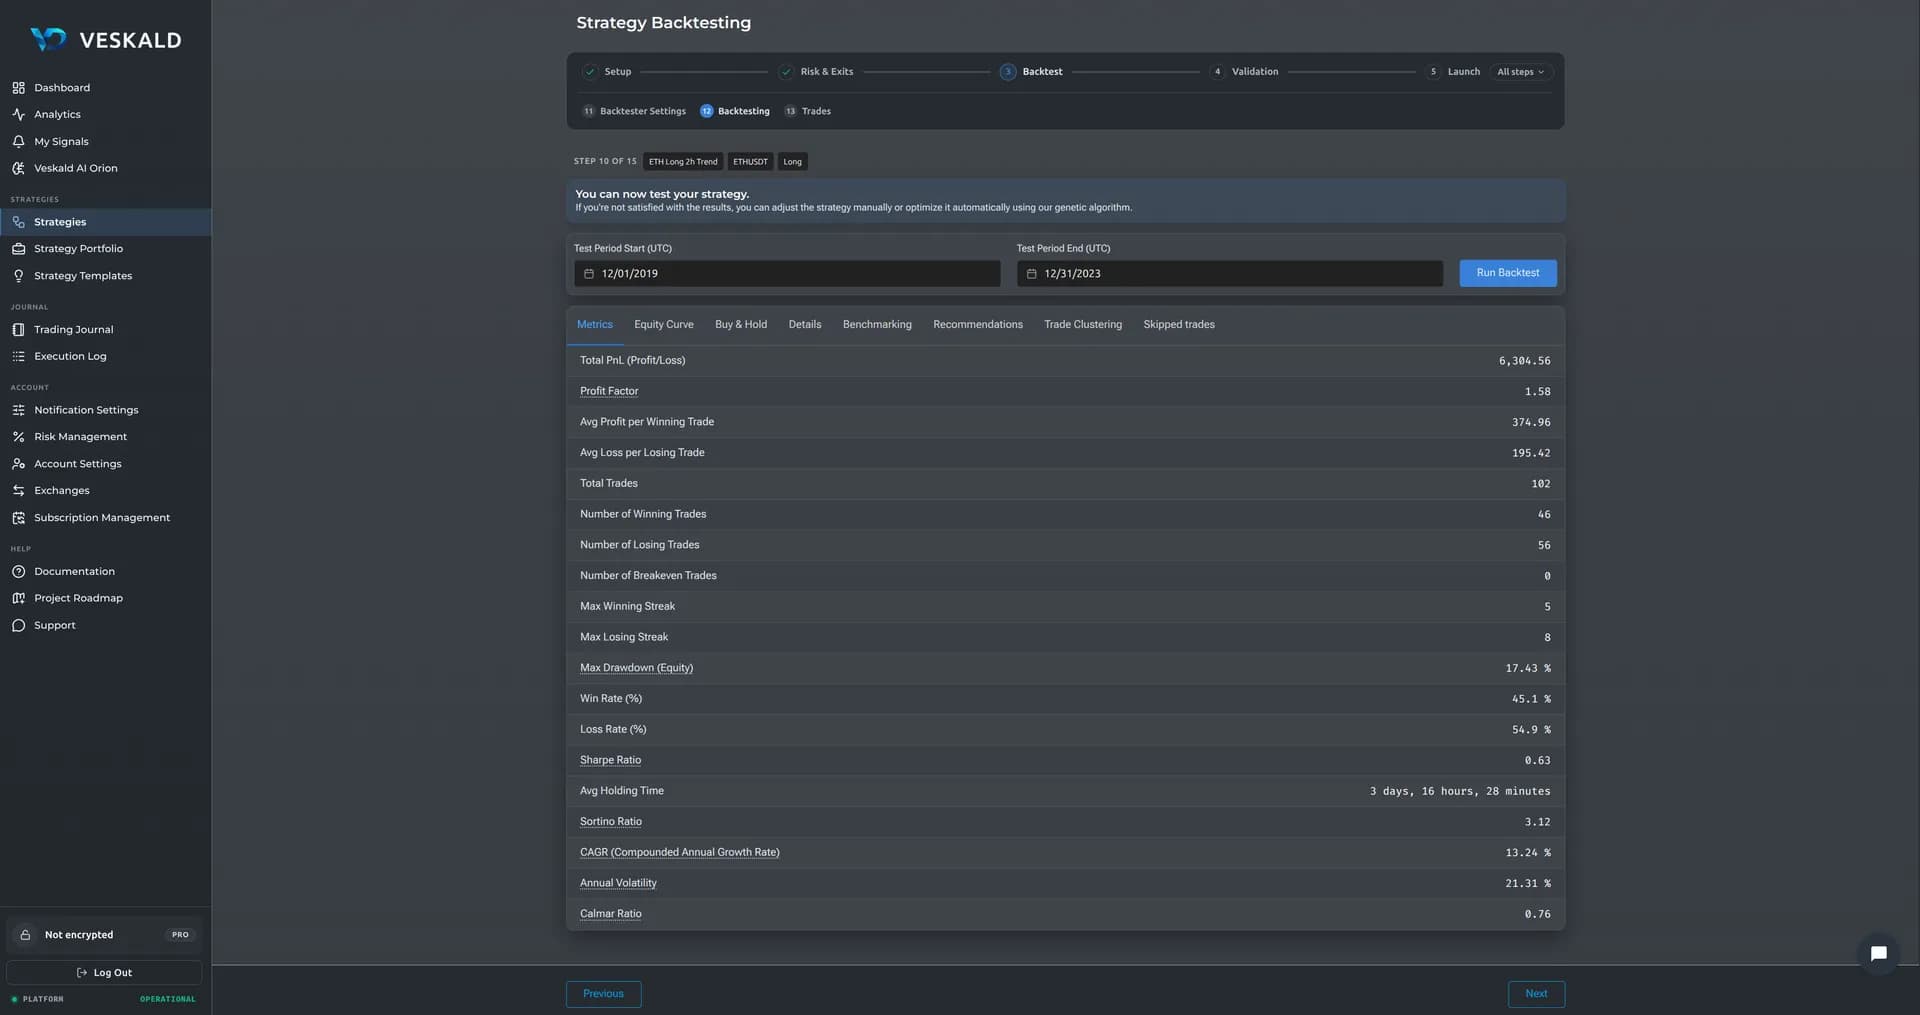
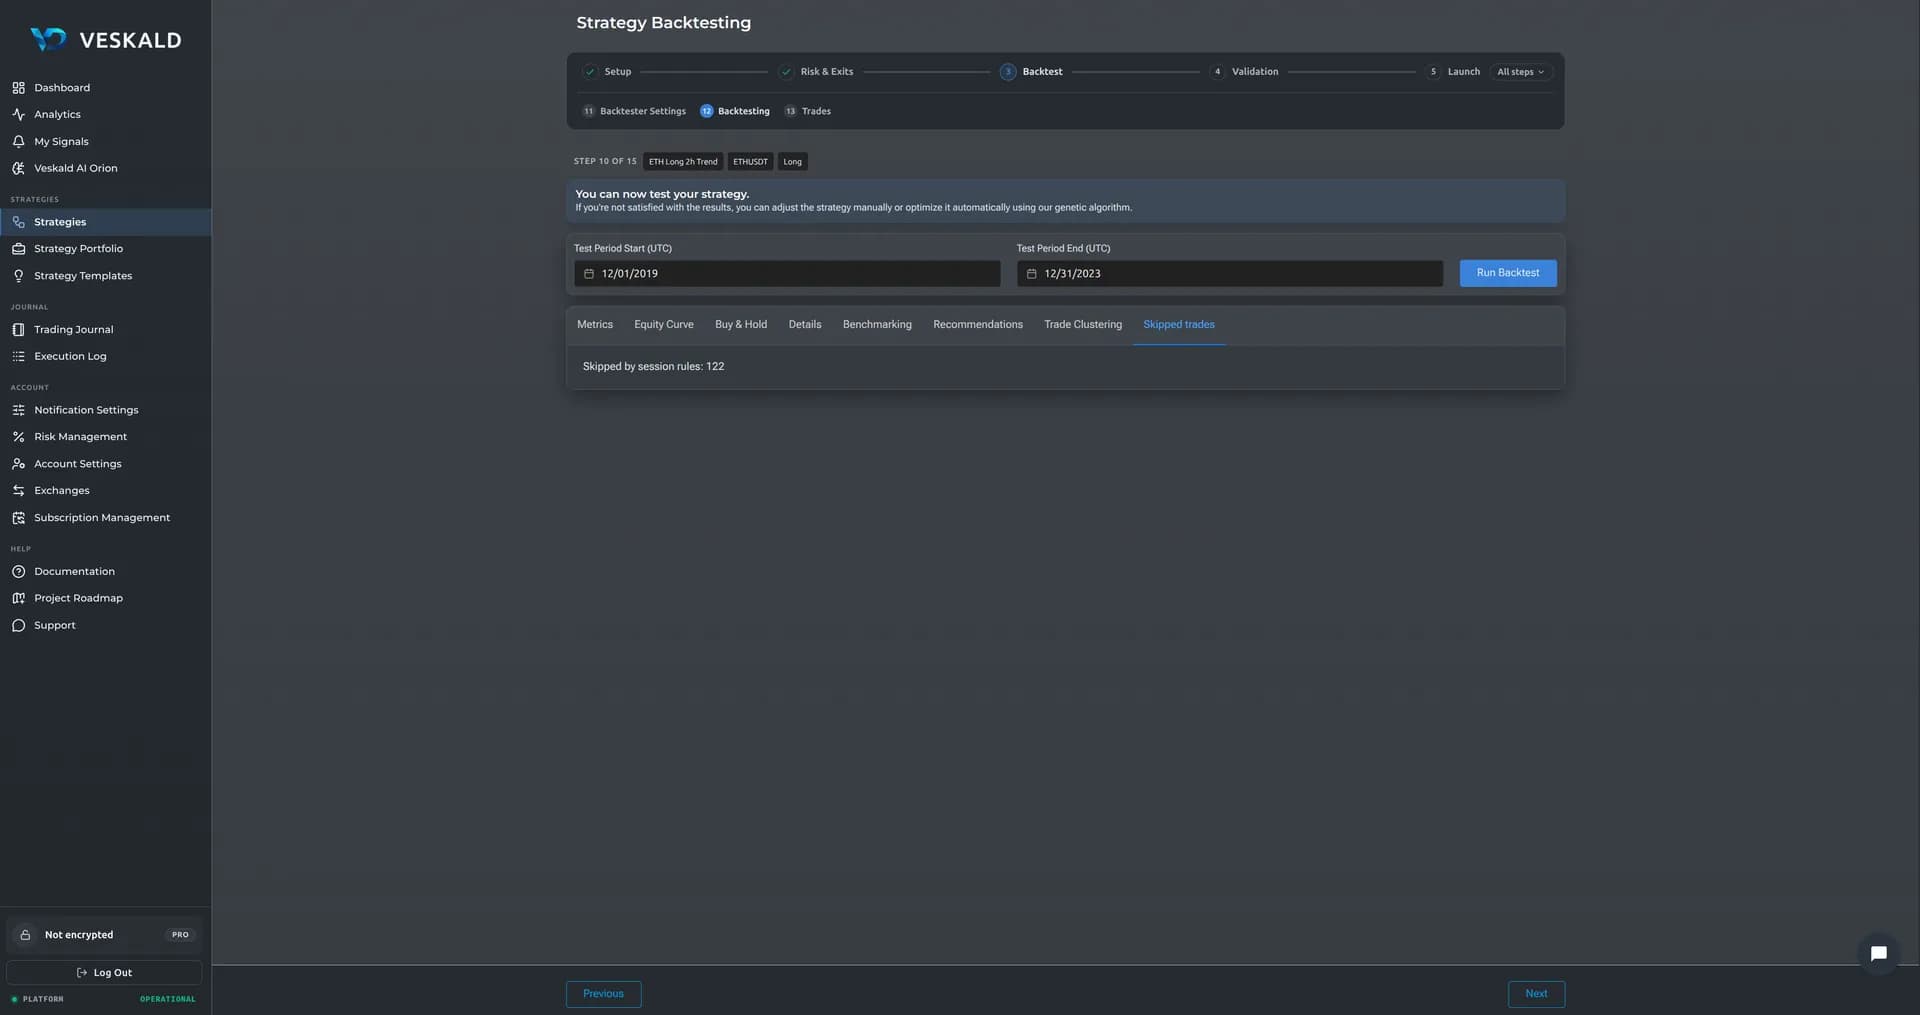
Veskald’s backtest accounts for every real-trading cost: you set commission yourself based on your exchange tier, funding recalculates every 8 hours, slippage depends on liquidity, and on large orders the impact of size on execution price is included. And the strategy you test is the one that trades: live trading uses the same rules, the same calculations and the same price data from your exchange. The backtester core parameters are open — you see exactly how each trade is calculated and can tune the math to your trading profile. On trades up to $300, entry price, slippage and costs differ from the backtest by less than 0.5% — check it in the Execution Log.
Position size is calculated, not set: you say what you risk, and the size follows from the risk and the distance to the stop, rounded down to the instrument’s step and capped by a share of recent volume; leverage is picked so the liquidation price sits beyond the stop. If nothing fits, the trade is not opened — and skipped trades are shown with the reason, split into the ones your skip rules blocked and the ones the engine refused. The same code runs the backtest and the live strategy, with one modelled difference: on history an entry is filled at the open of the next candle.
What you get after a backtest
- 20 performance metrics: Profit Factor, Sharpe, Sortino, Calmar, Max Drawdown, CAGR
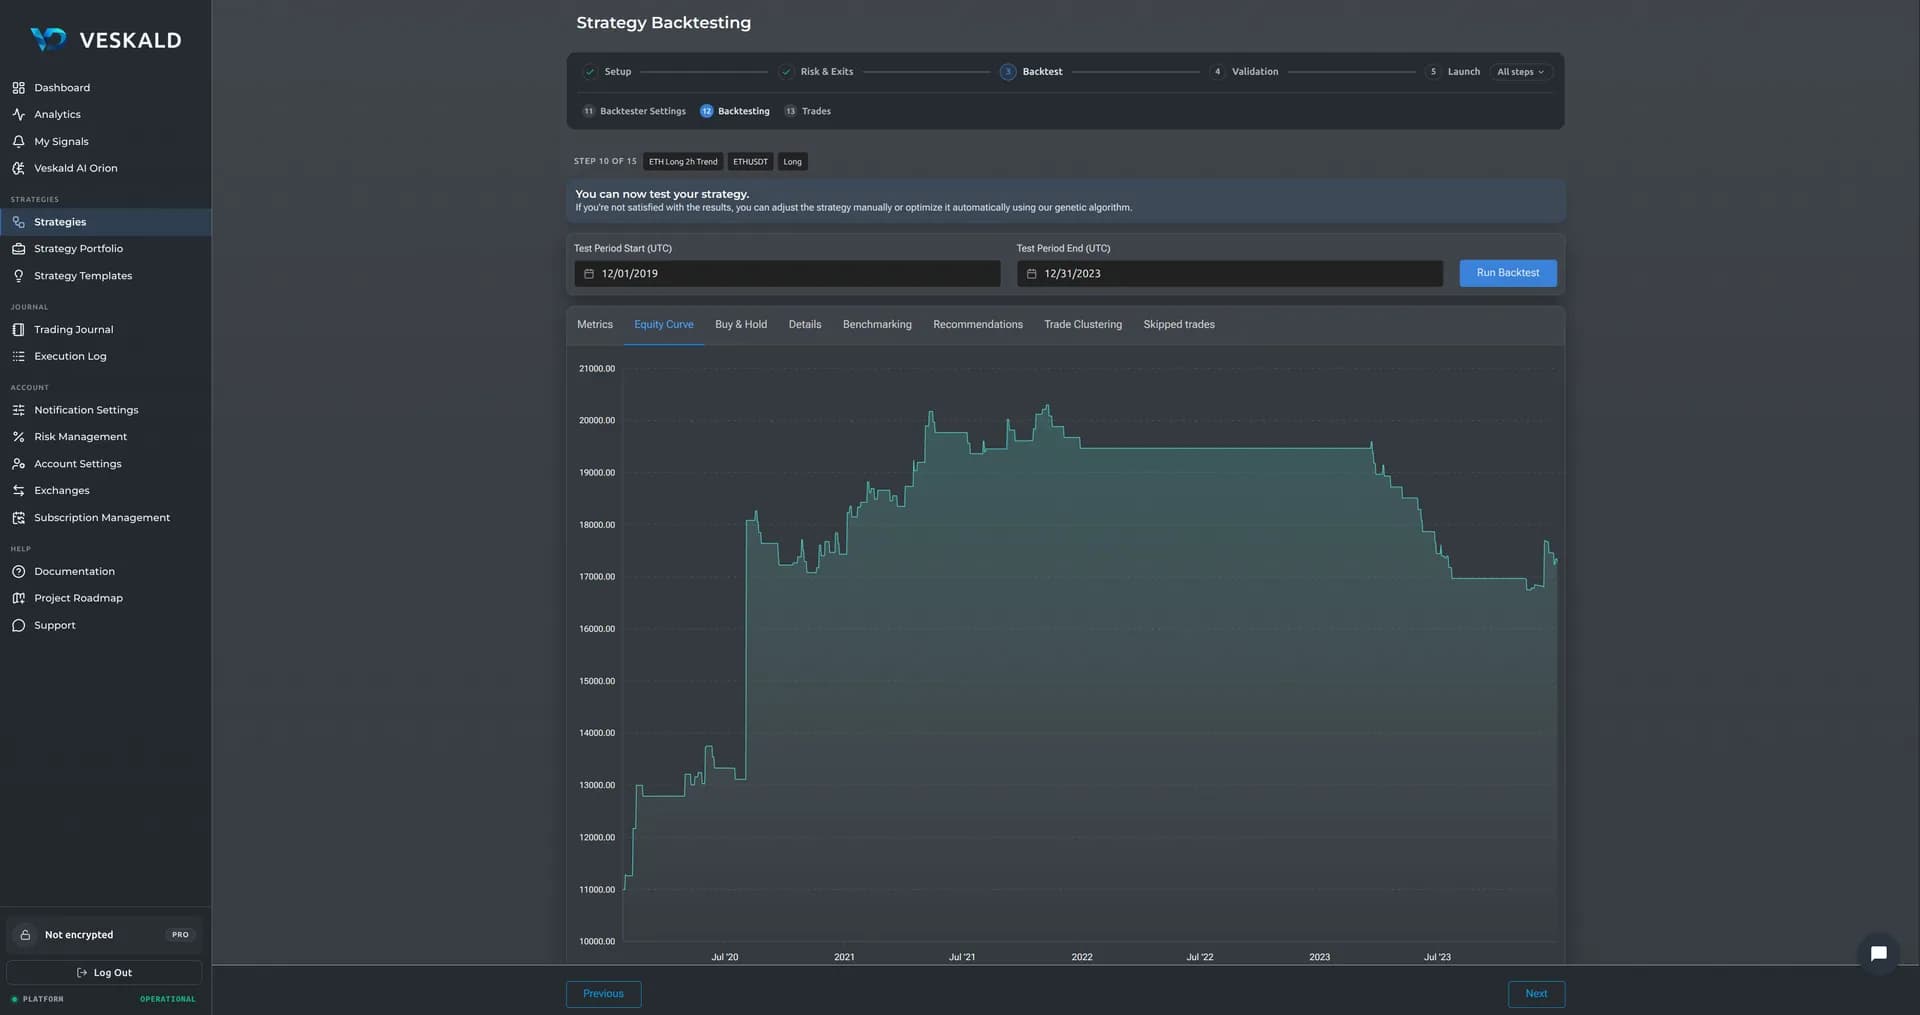
- Equity curve with zoom by period
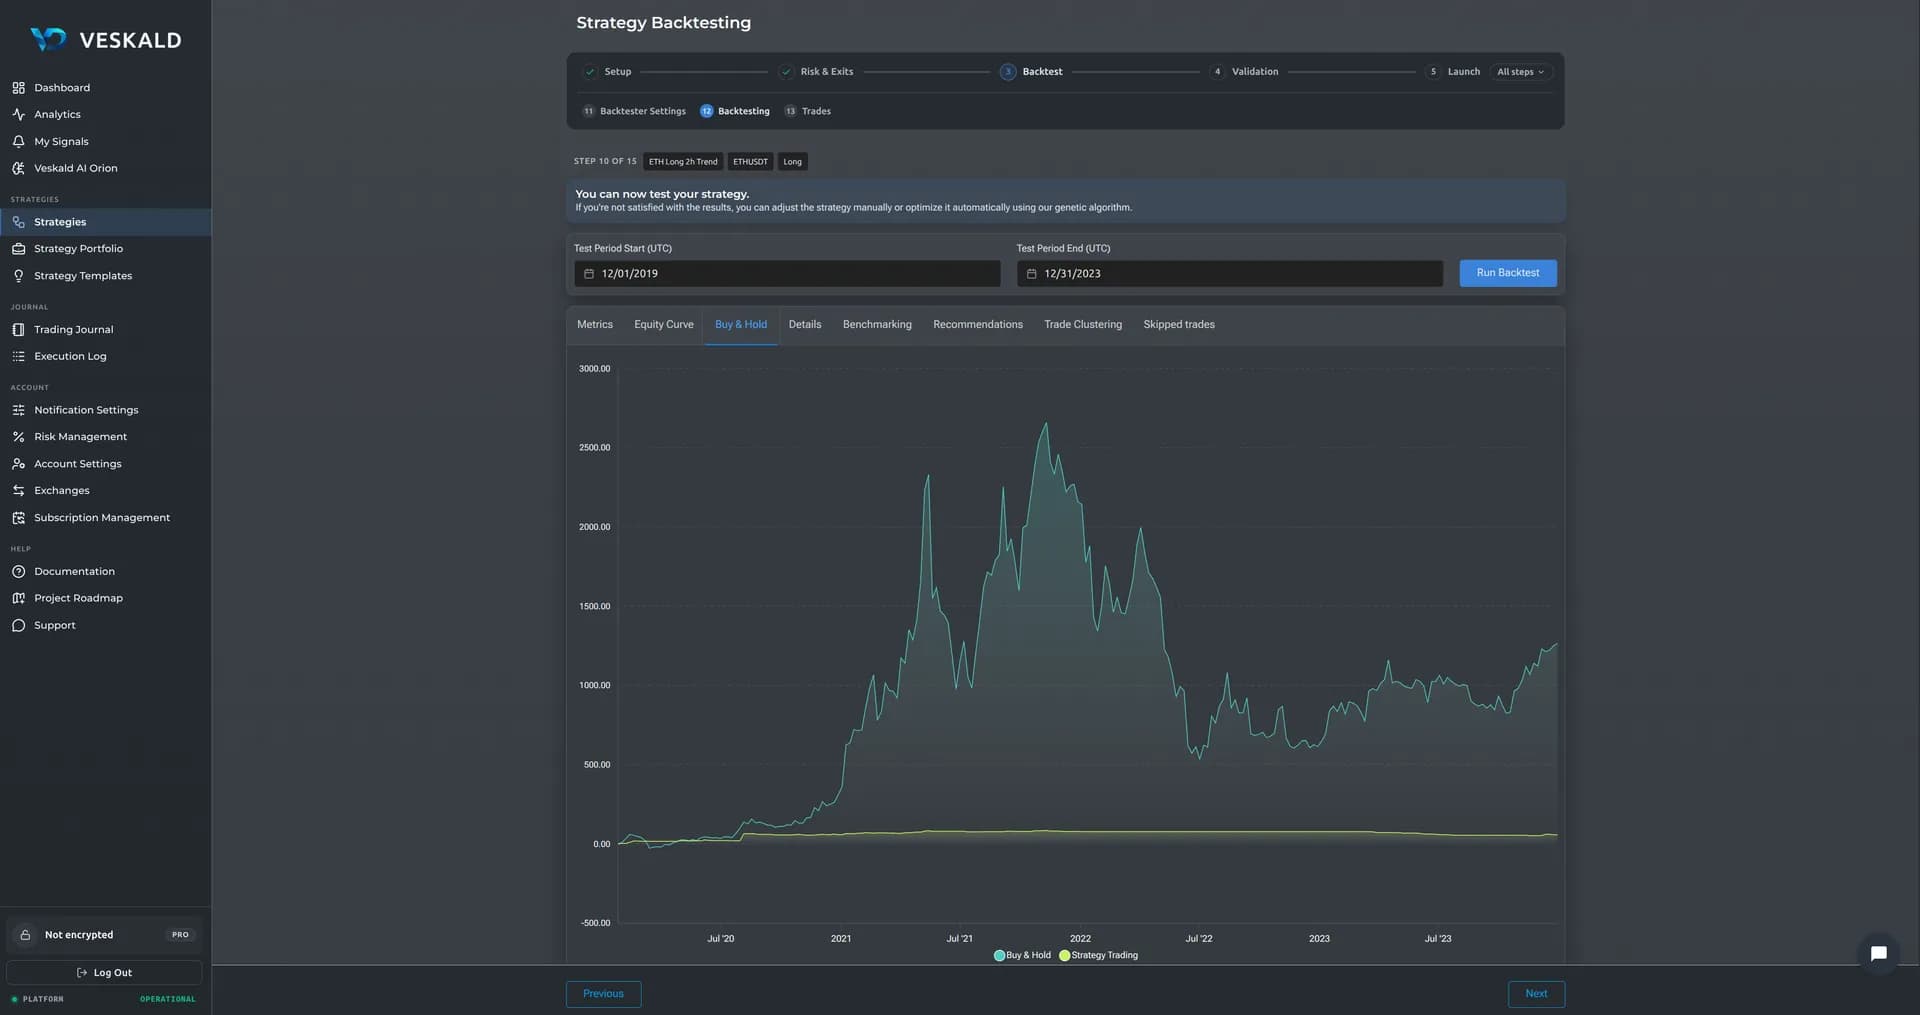
- Comparison against Buy & Hold
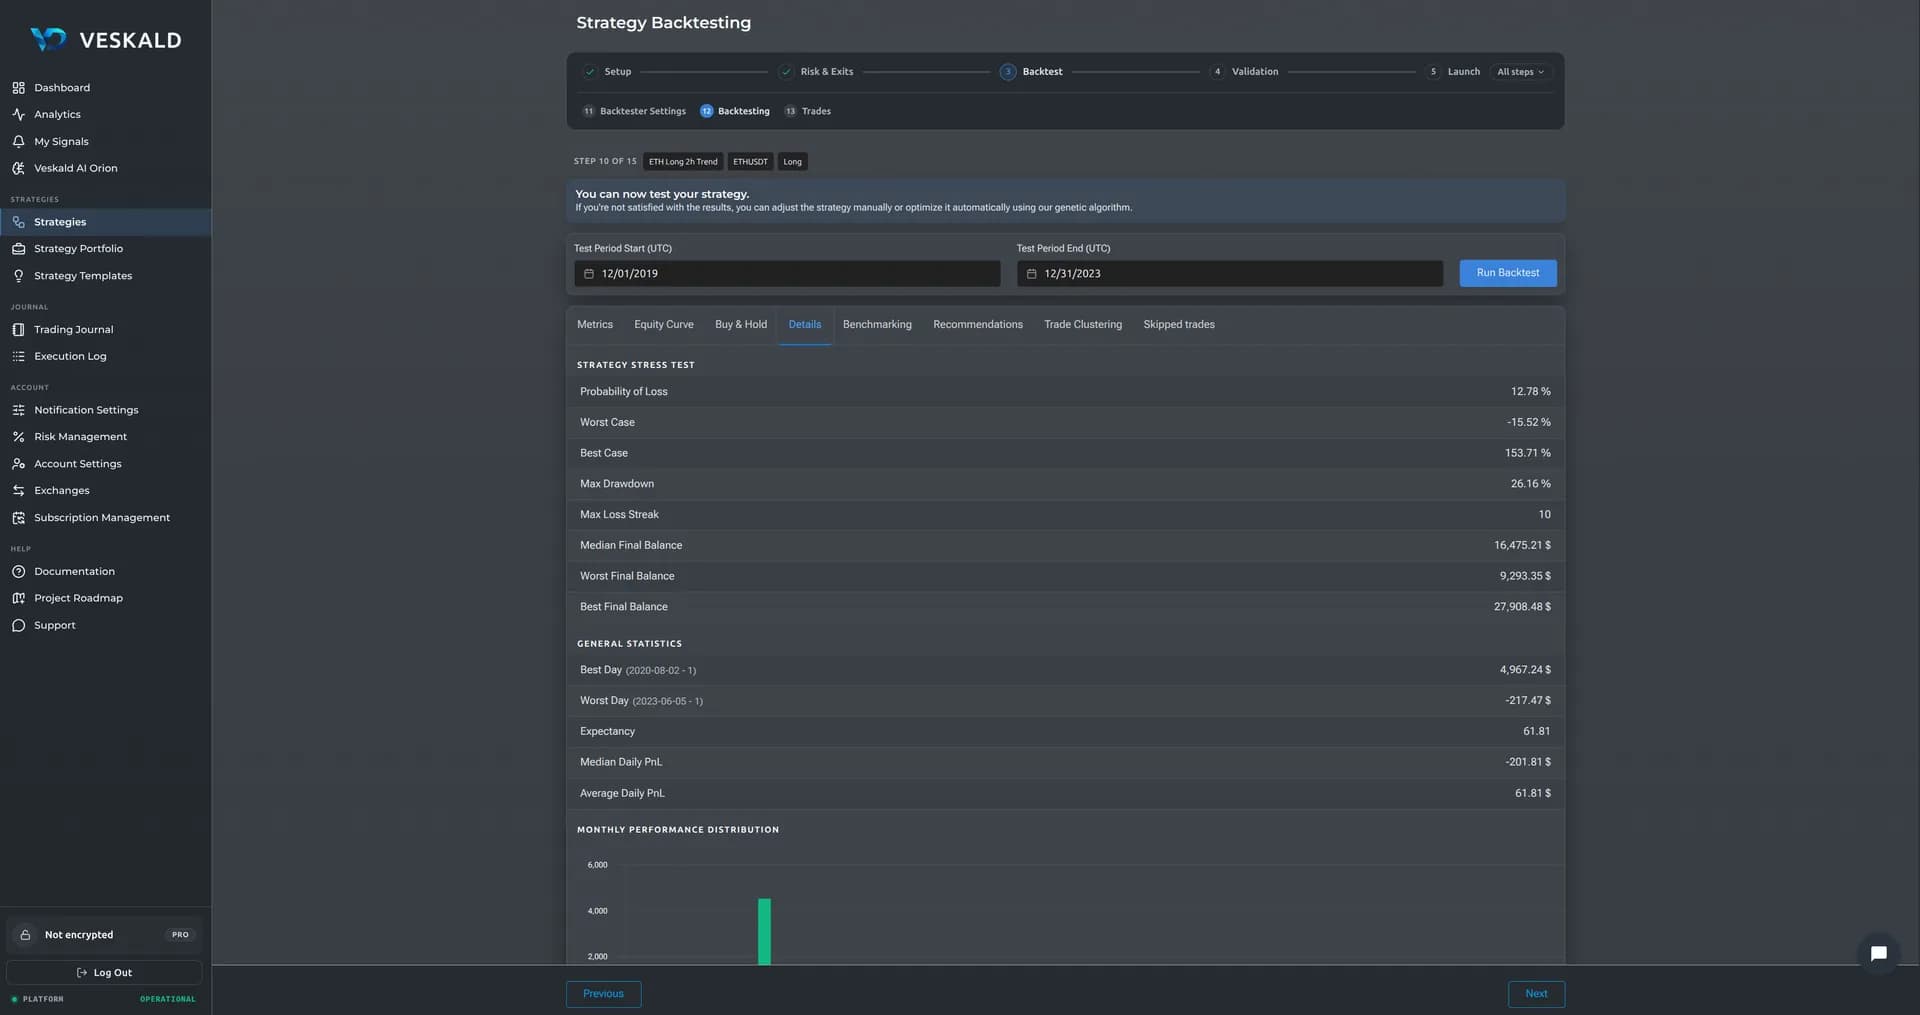
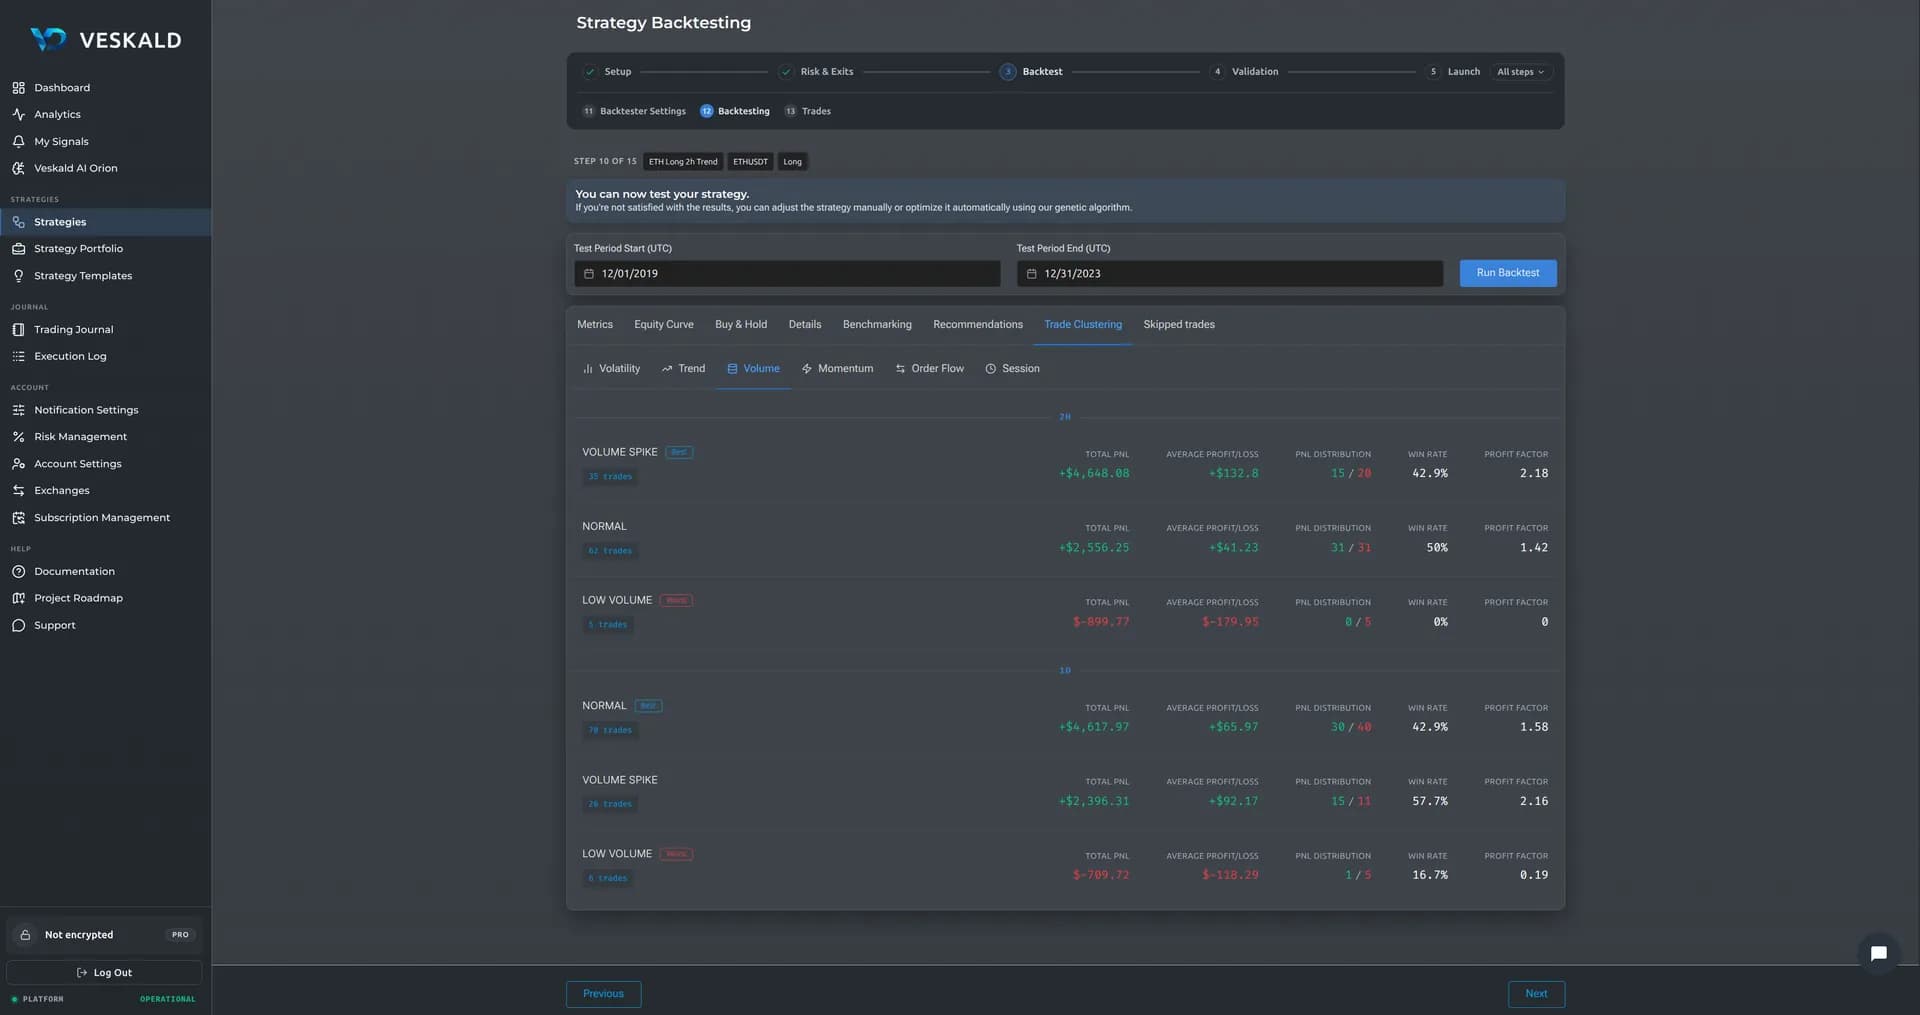
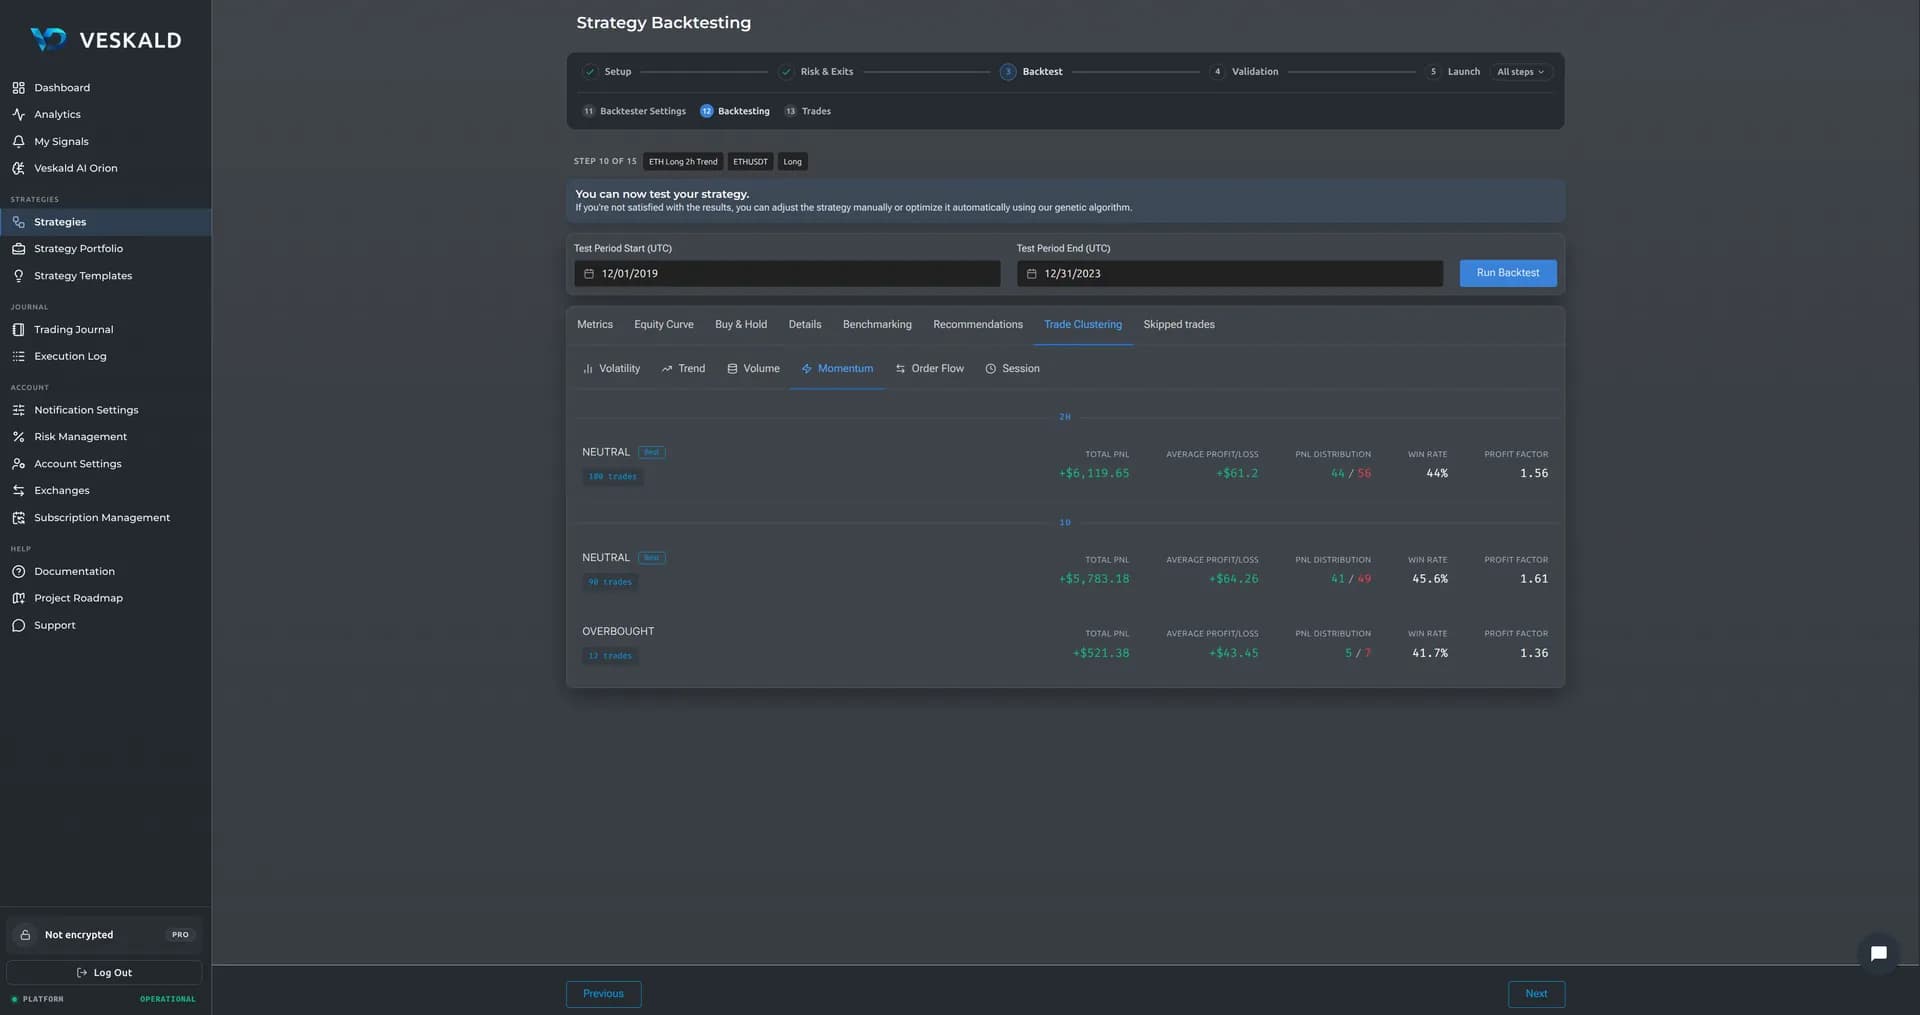
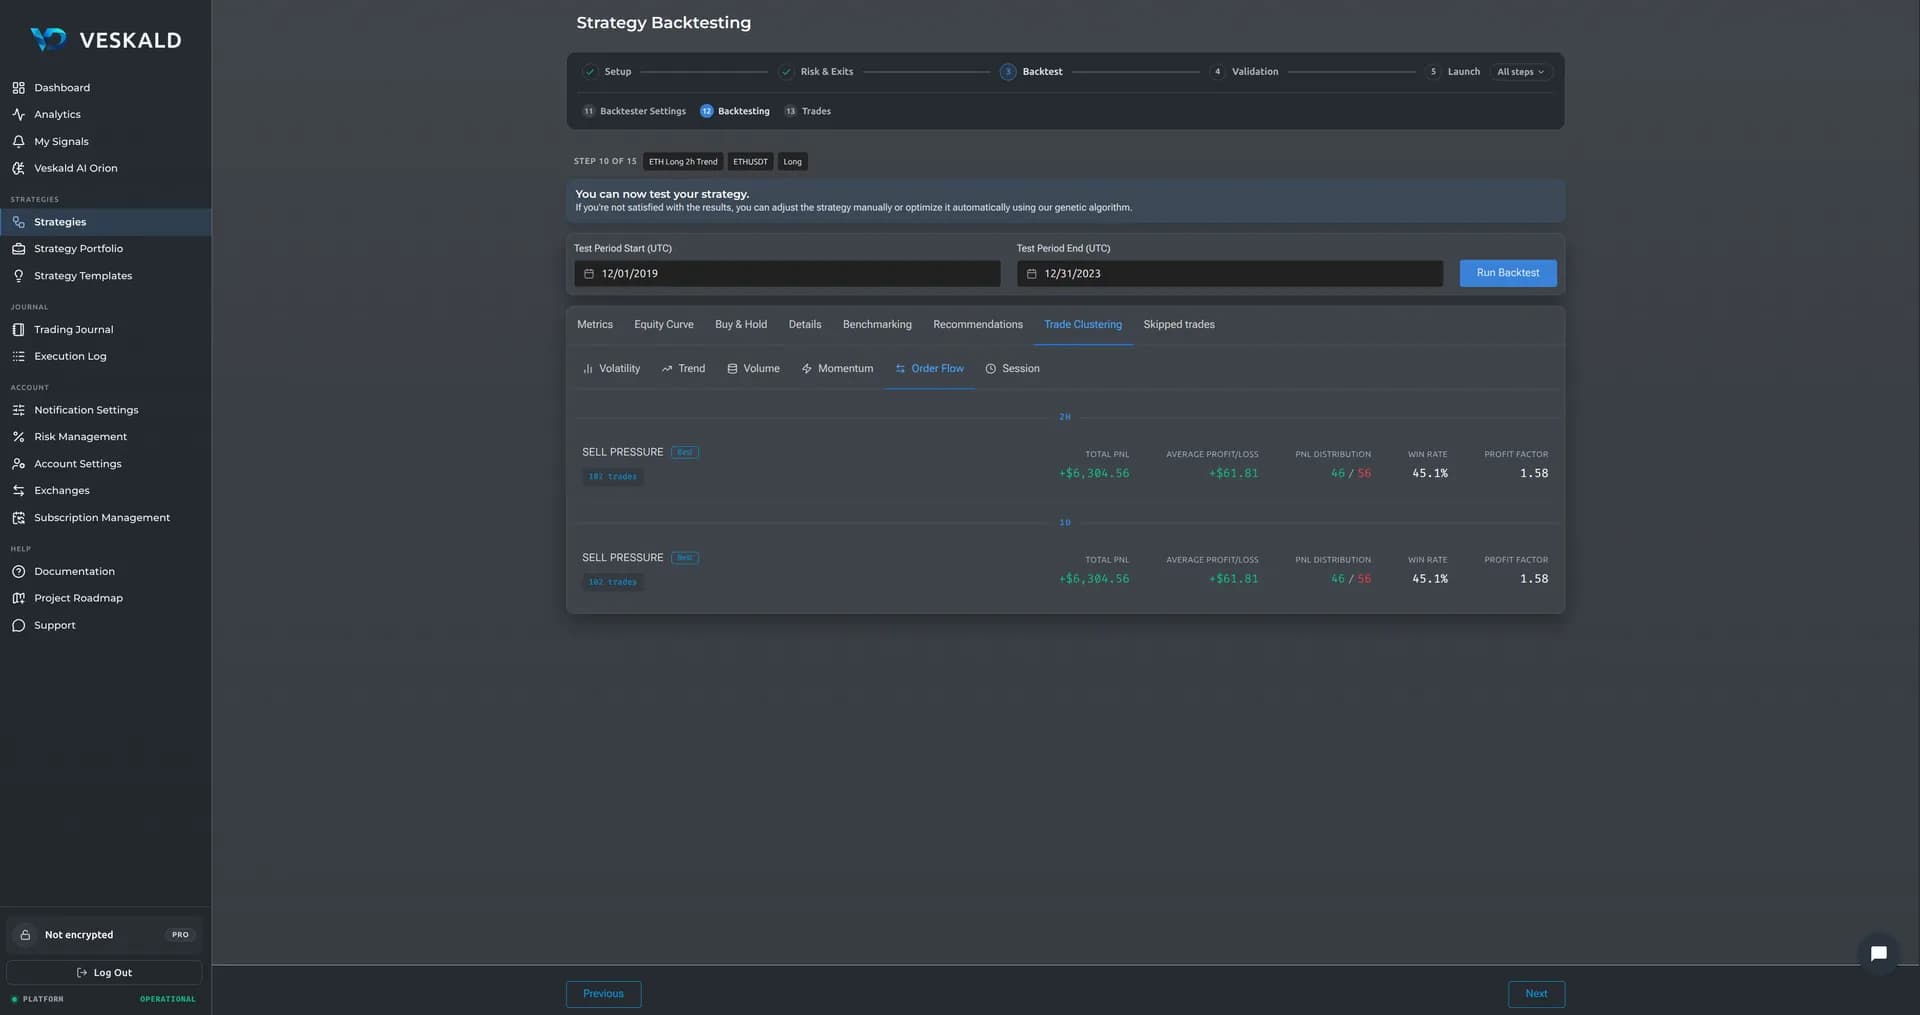
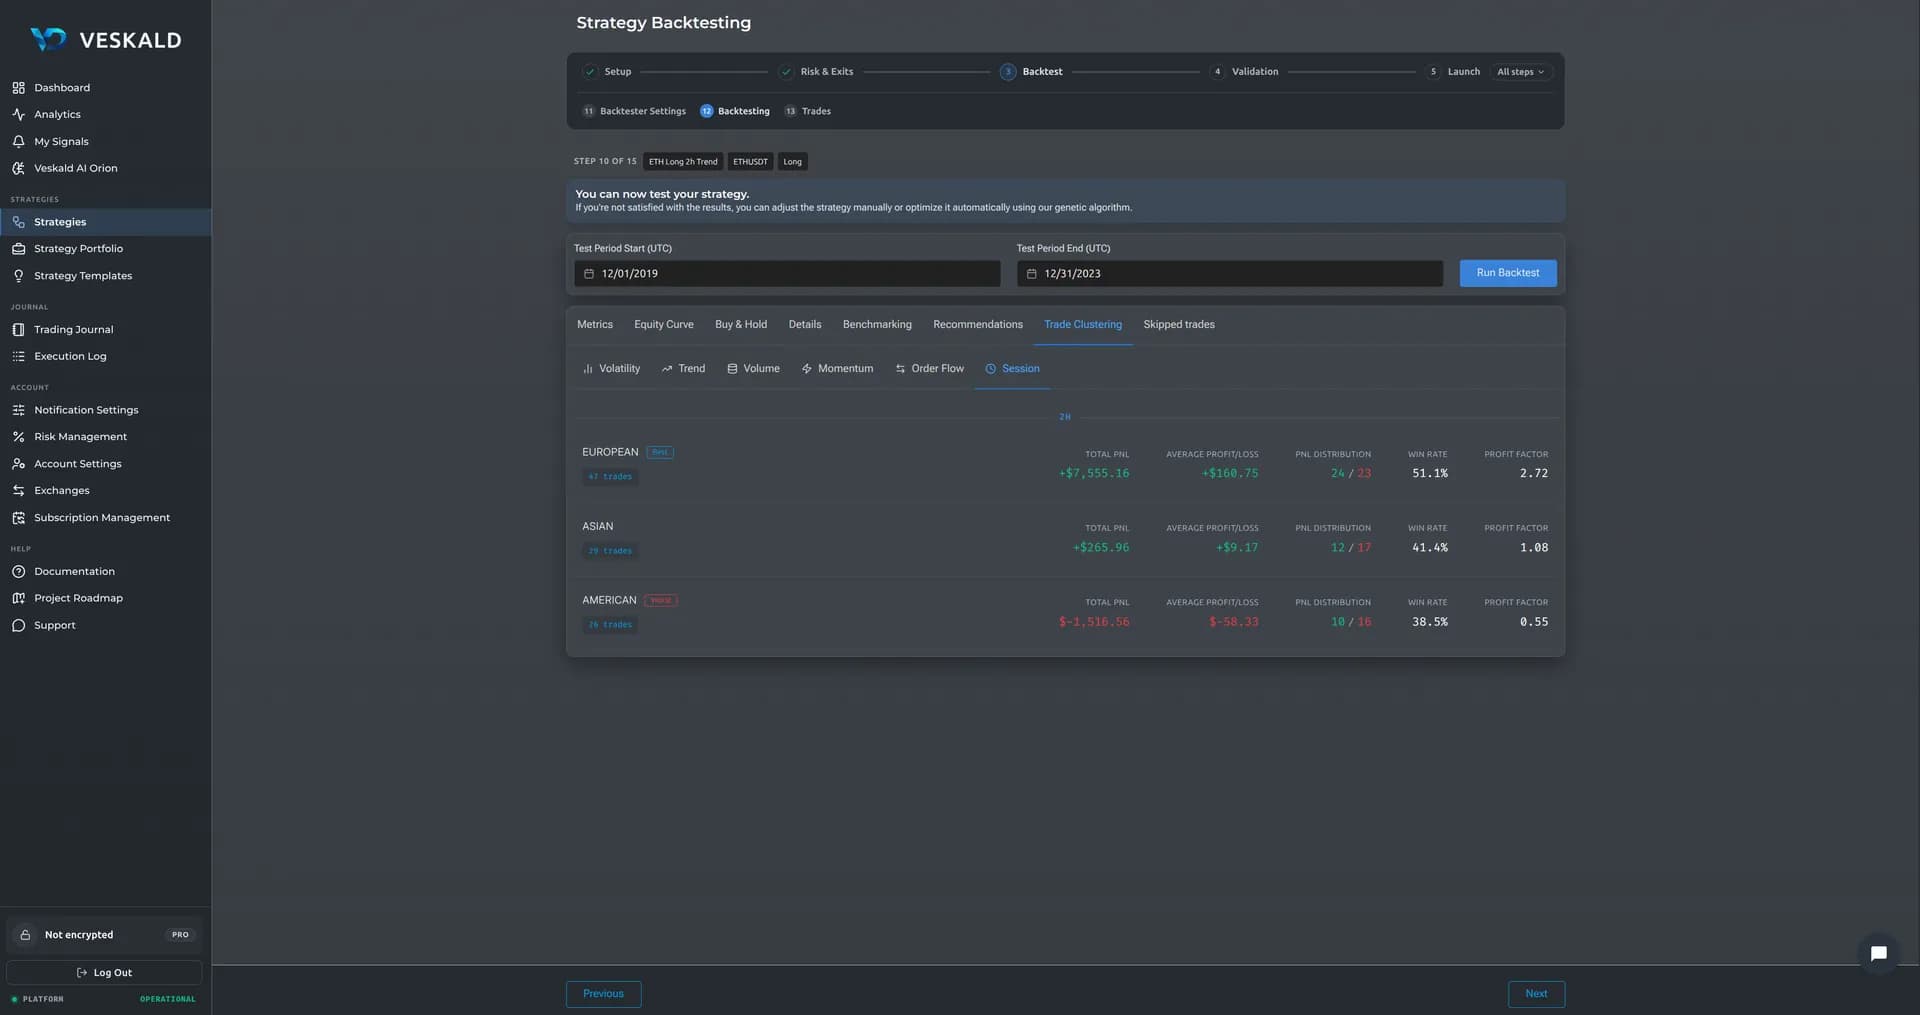
- Monte Carlo: trade permutation and bootstrap — probability of loss, worst drawdown, longest losing streak, median and worst final balance
- Market-regime map — where the strategy earns, where it bleeds
- Auto-Insights — automatic recommendations based on clusters
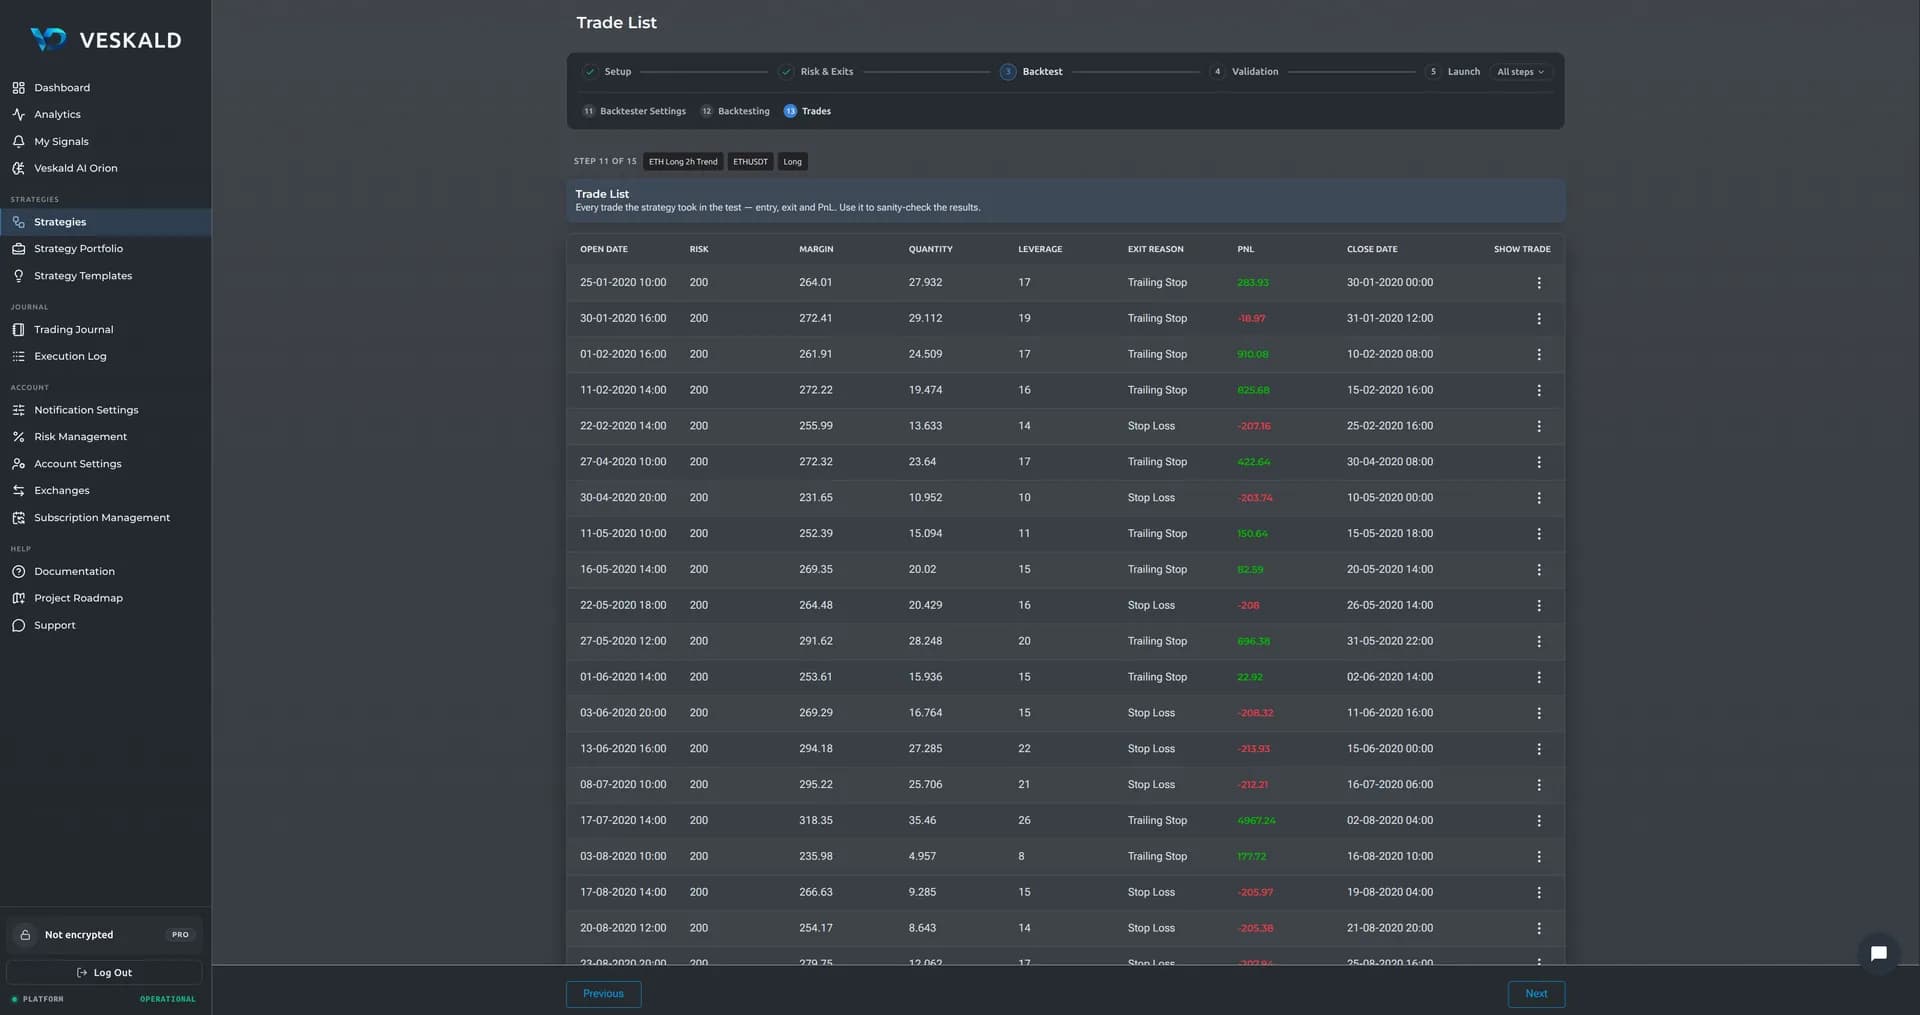
- Every trade available for review, candle by candle
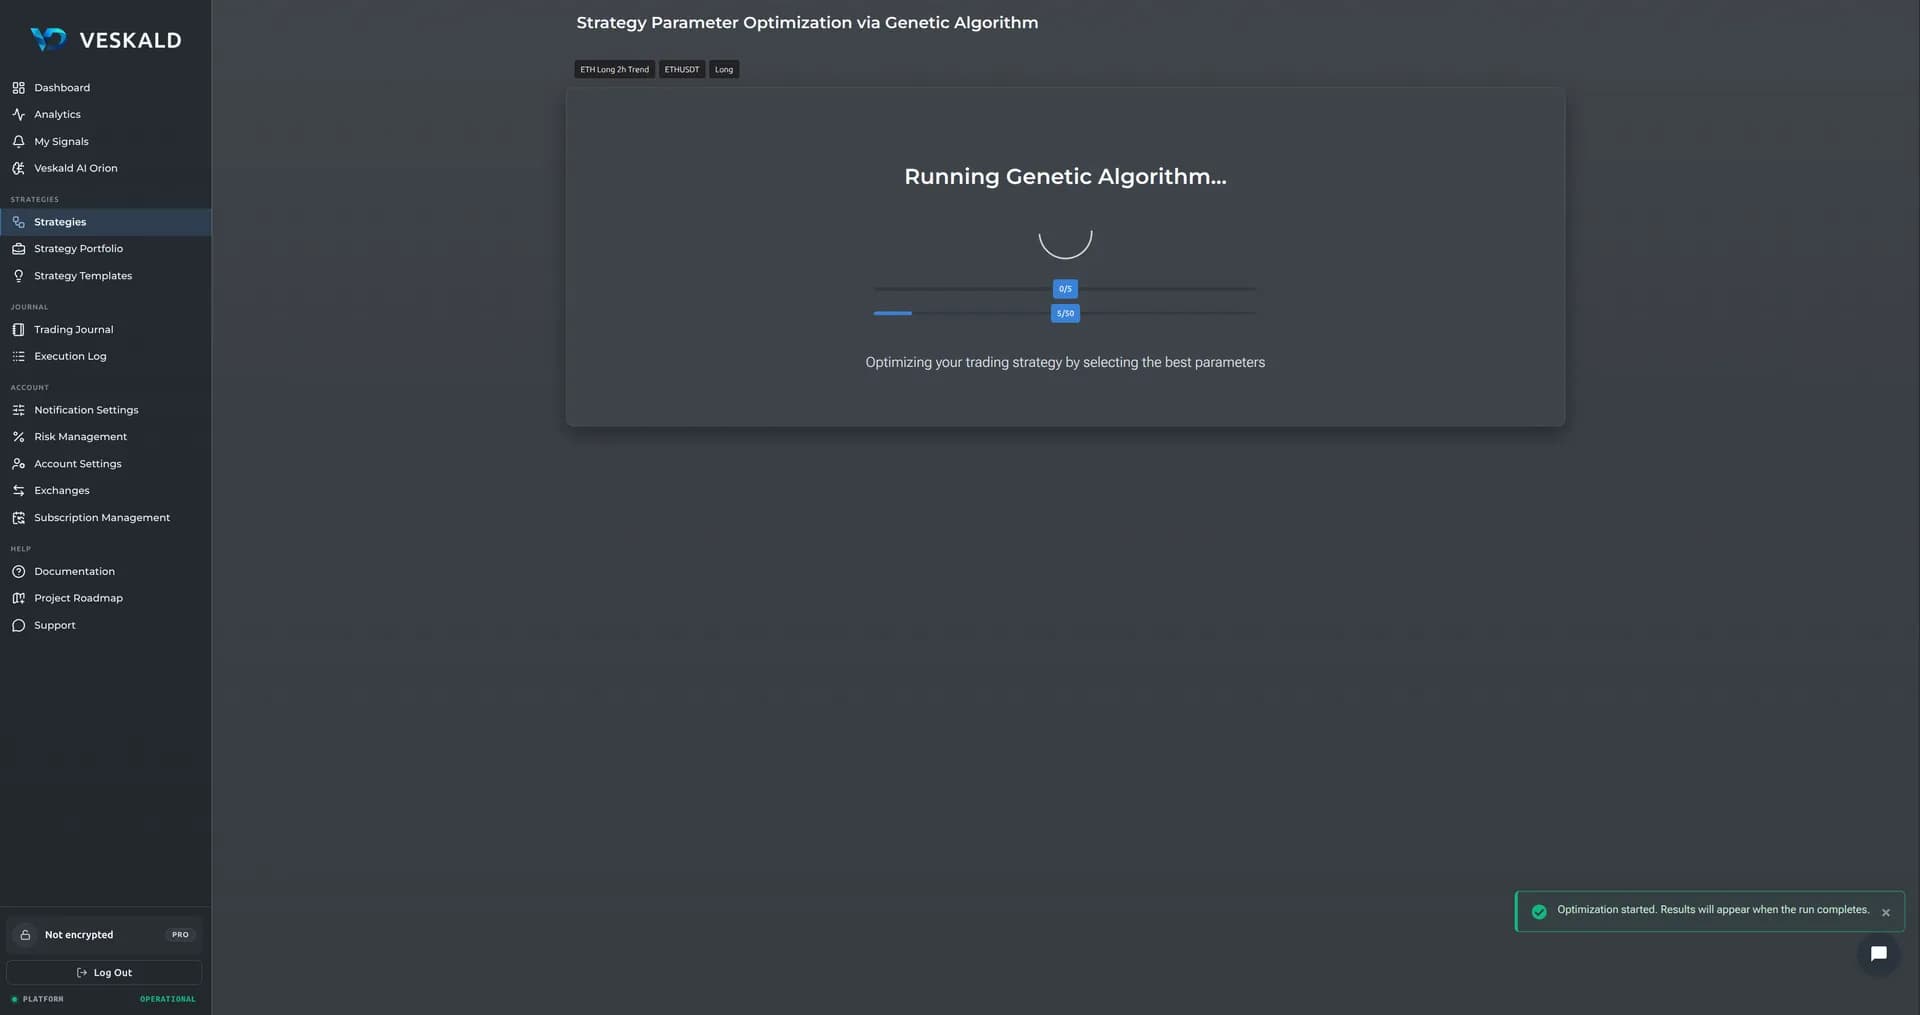
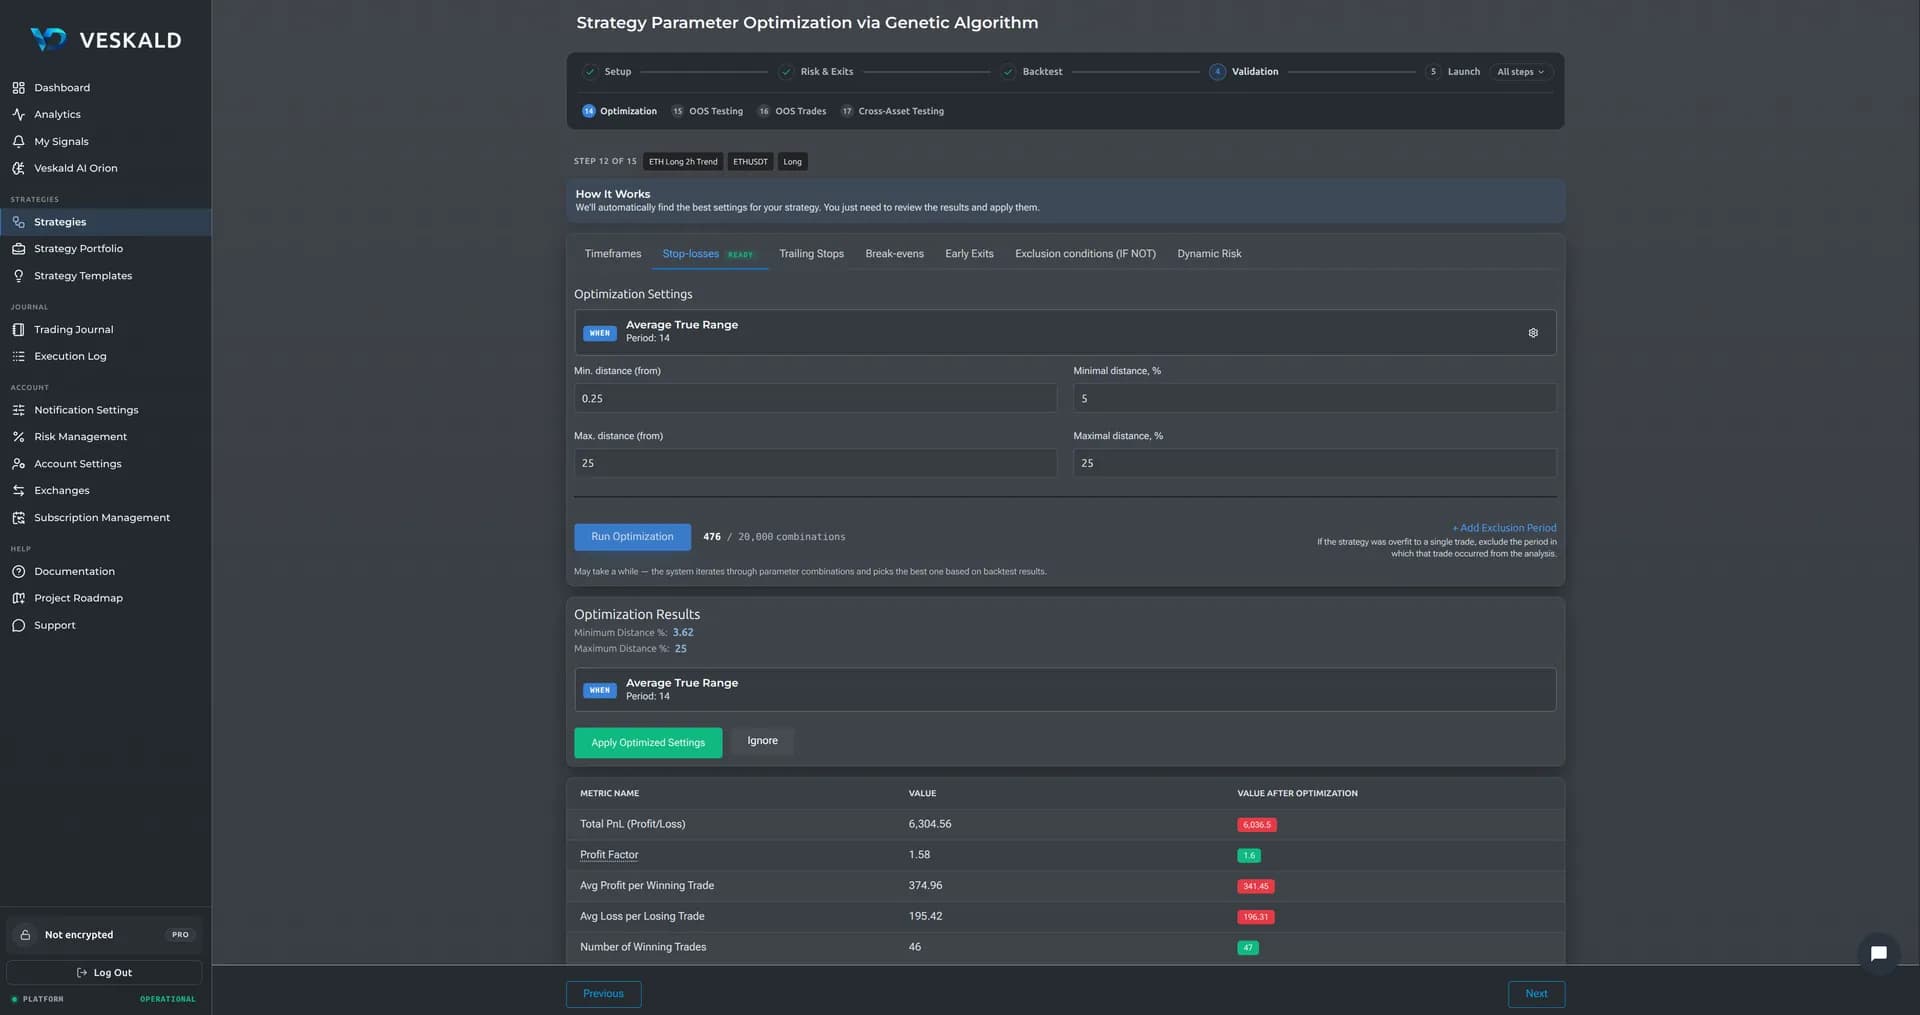
Automated strategy tuning
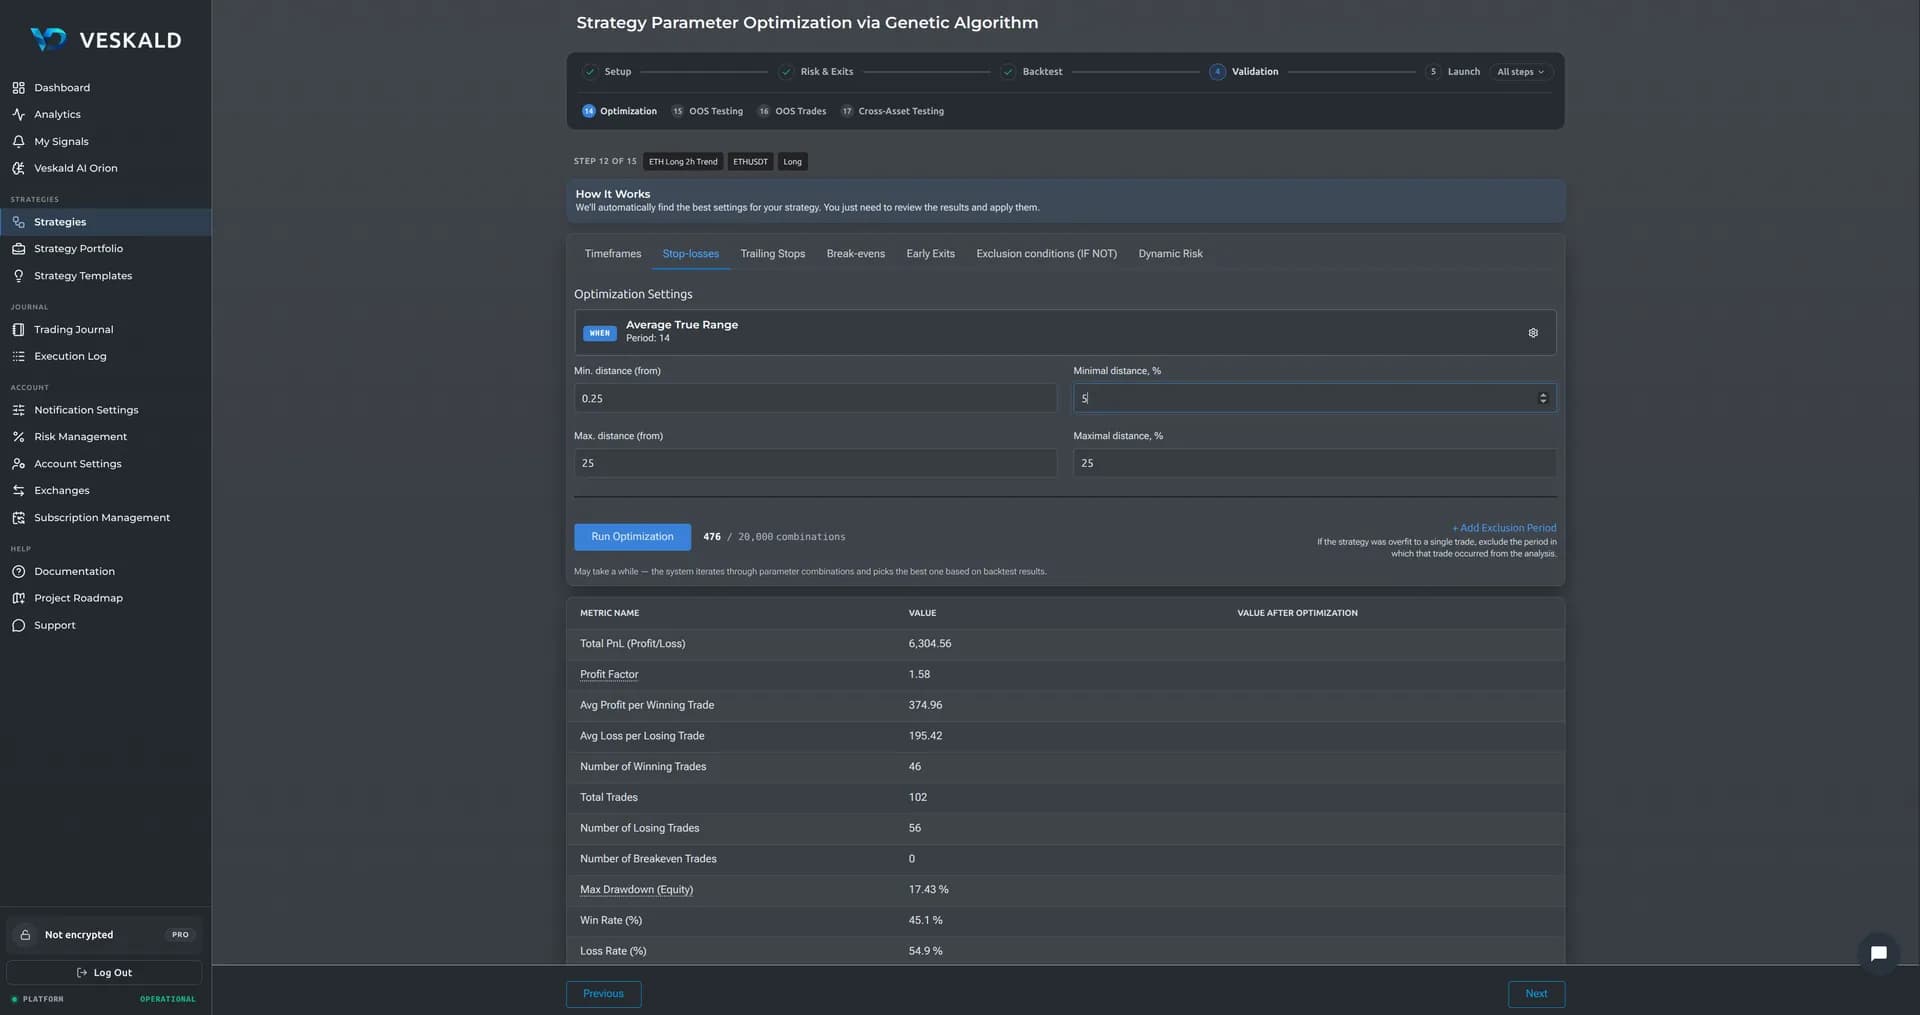
Replaces weeks of manual grid search. Looks for stability, not the peak.
By hand you will try 10–20 parameter combinations and get tired. A genetic algorithm goes through thousands. But it is not about speed — it is about what exactly it is looking for.
An approach that defends against overfitting
A smooth equity curve
the algorithm optimizes not for maximum profit (one lucky trade means nothing) but for a smooth equity curve
Population diversity
if all variants start to look the same — the system intervenes so you do not get stuck in a local maximum
Out-of-Sample validation
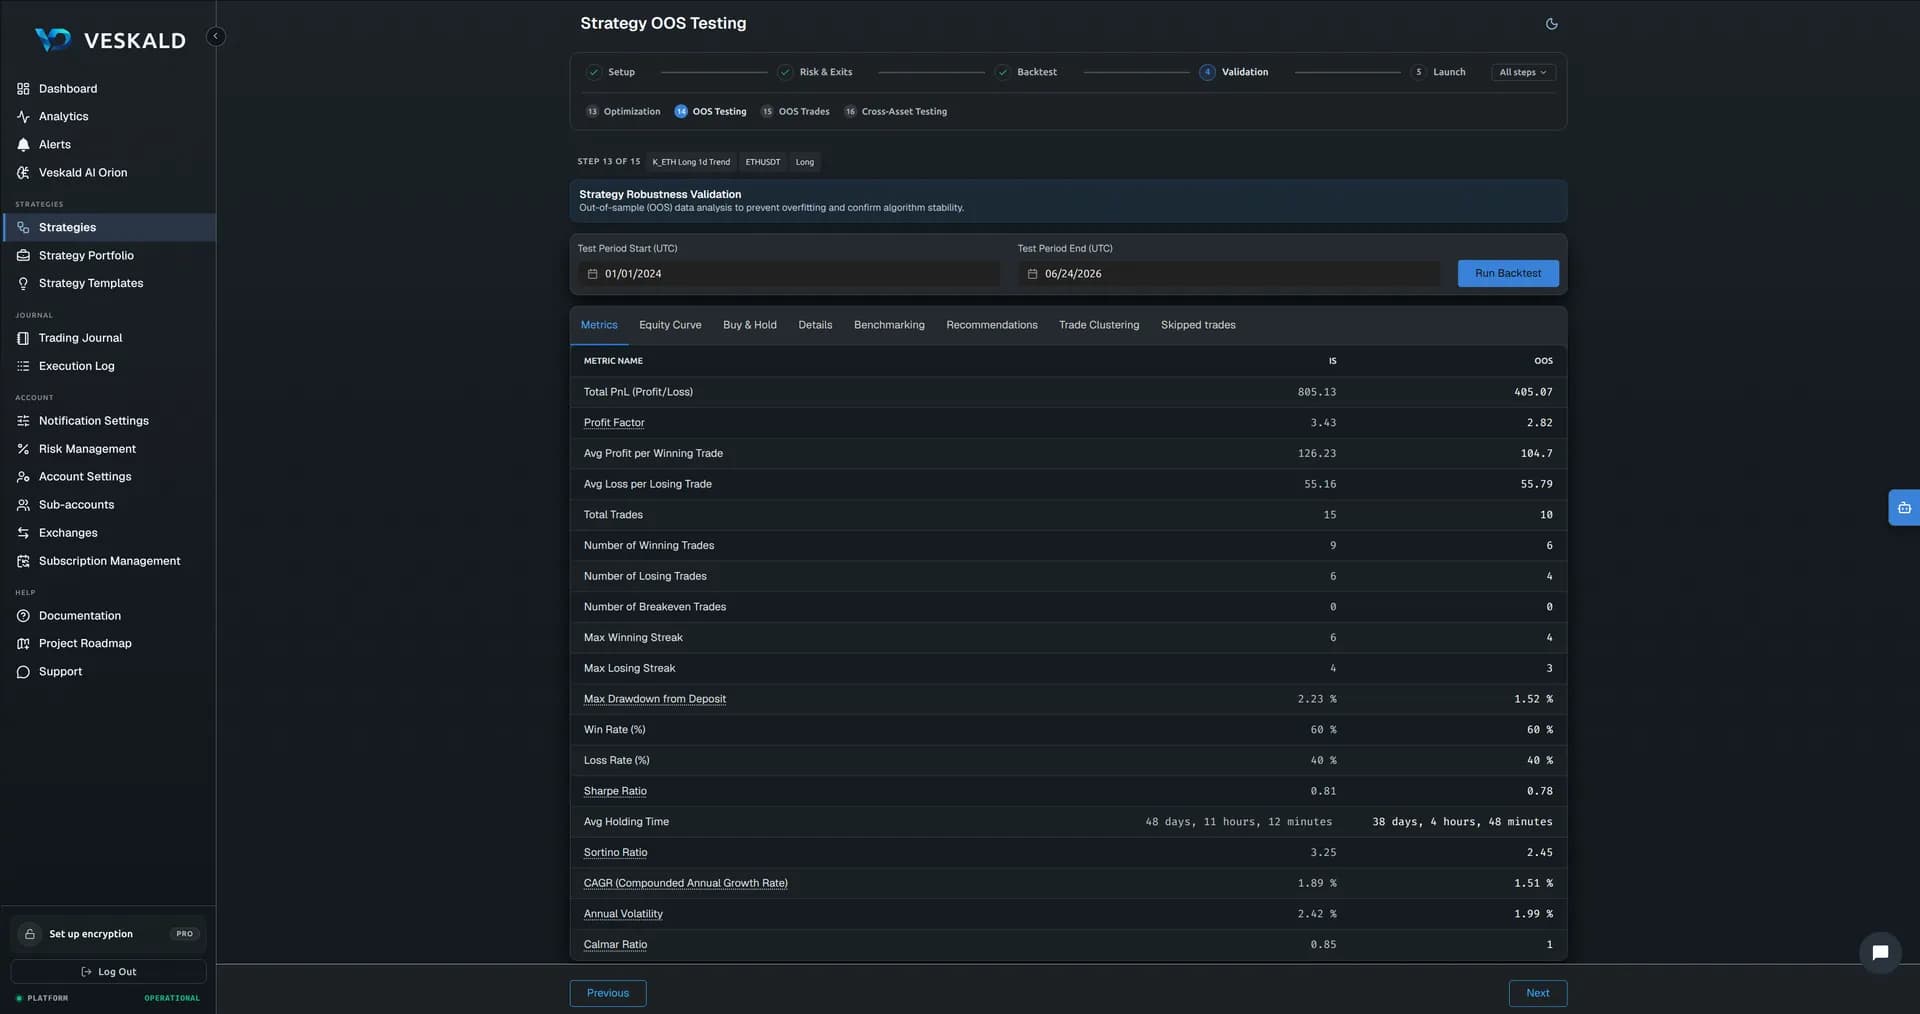
the optimizer only ever sees the in-sample data — the holdout is never passed to it. After the search the strategy is tested on that untouched part; if it drops, it was overfitting, back to the original parameters
Excluded periods
you can exclude anomalous periods (flash crashes, non-representative segments) from the search
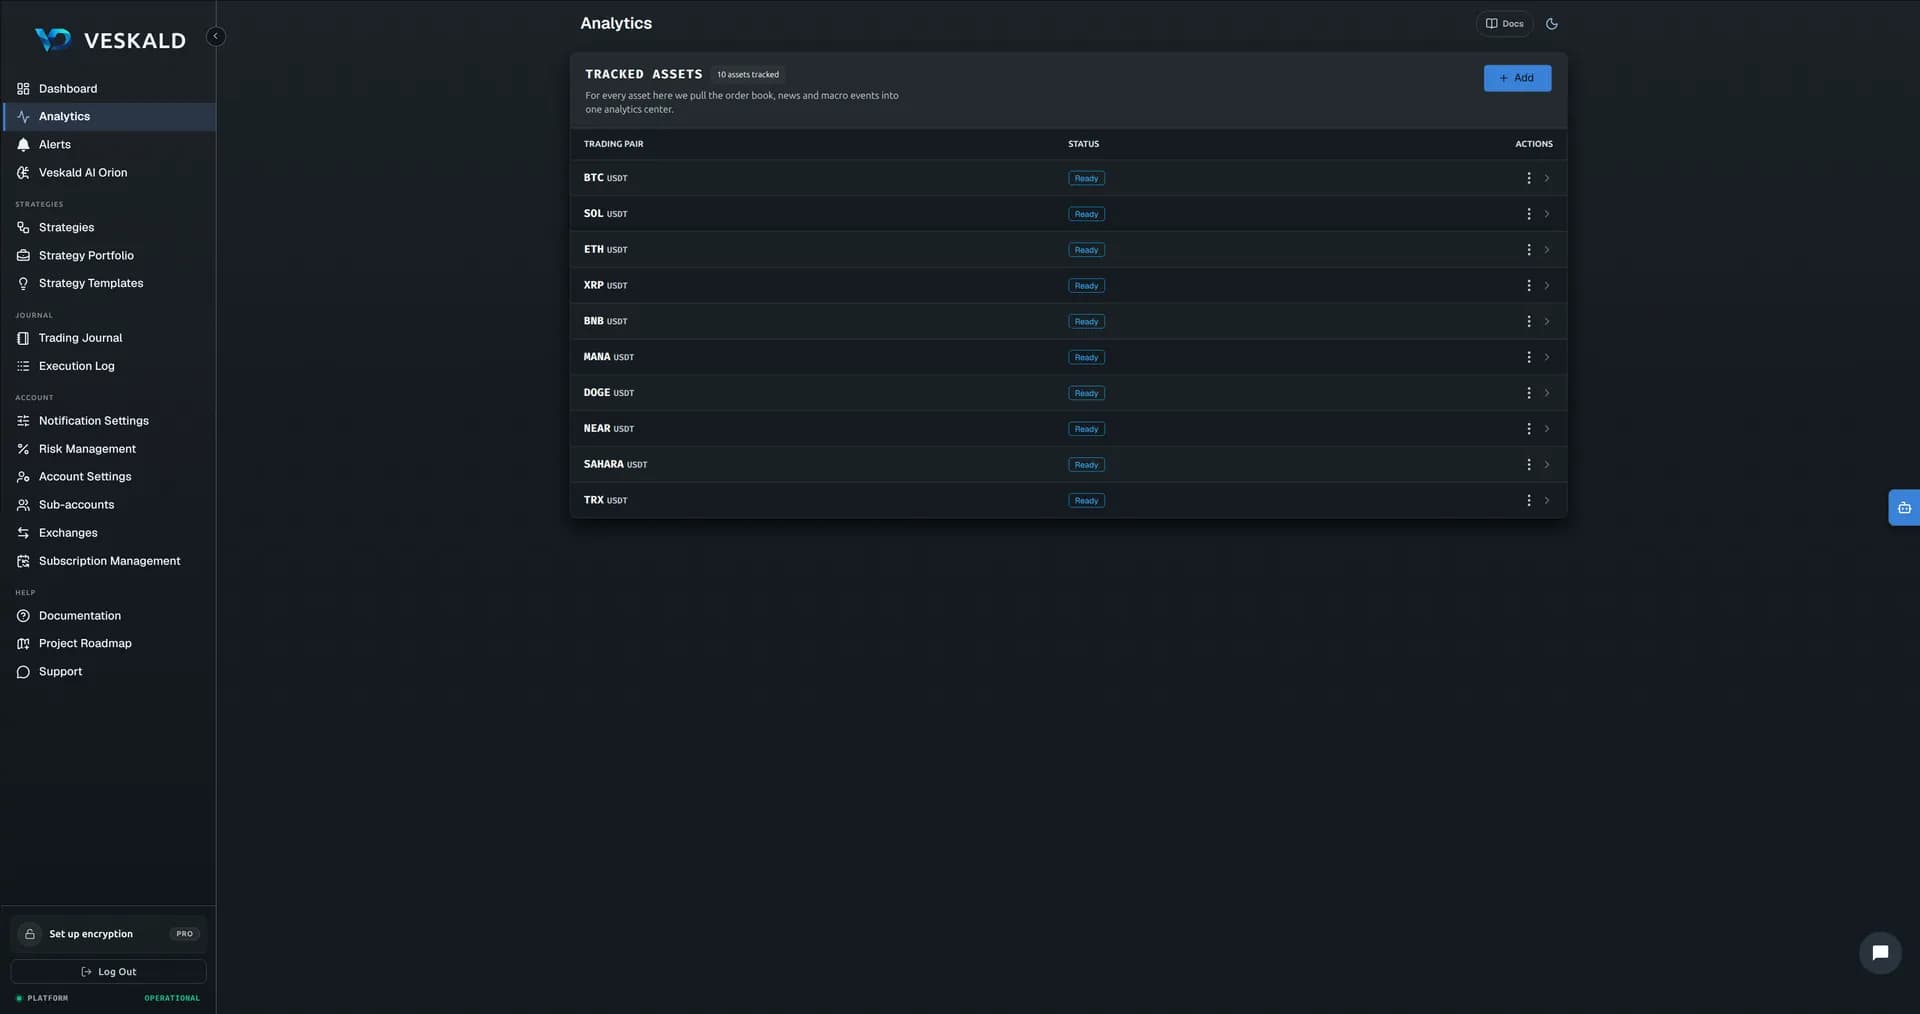
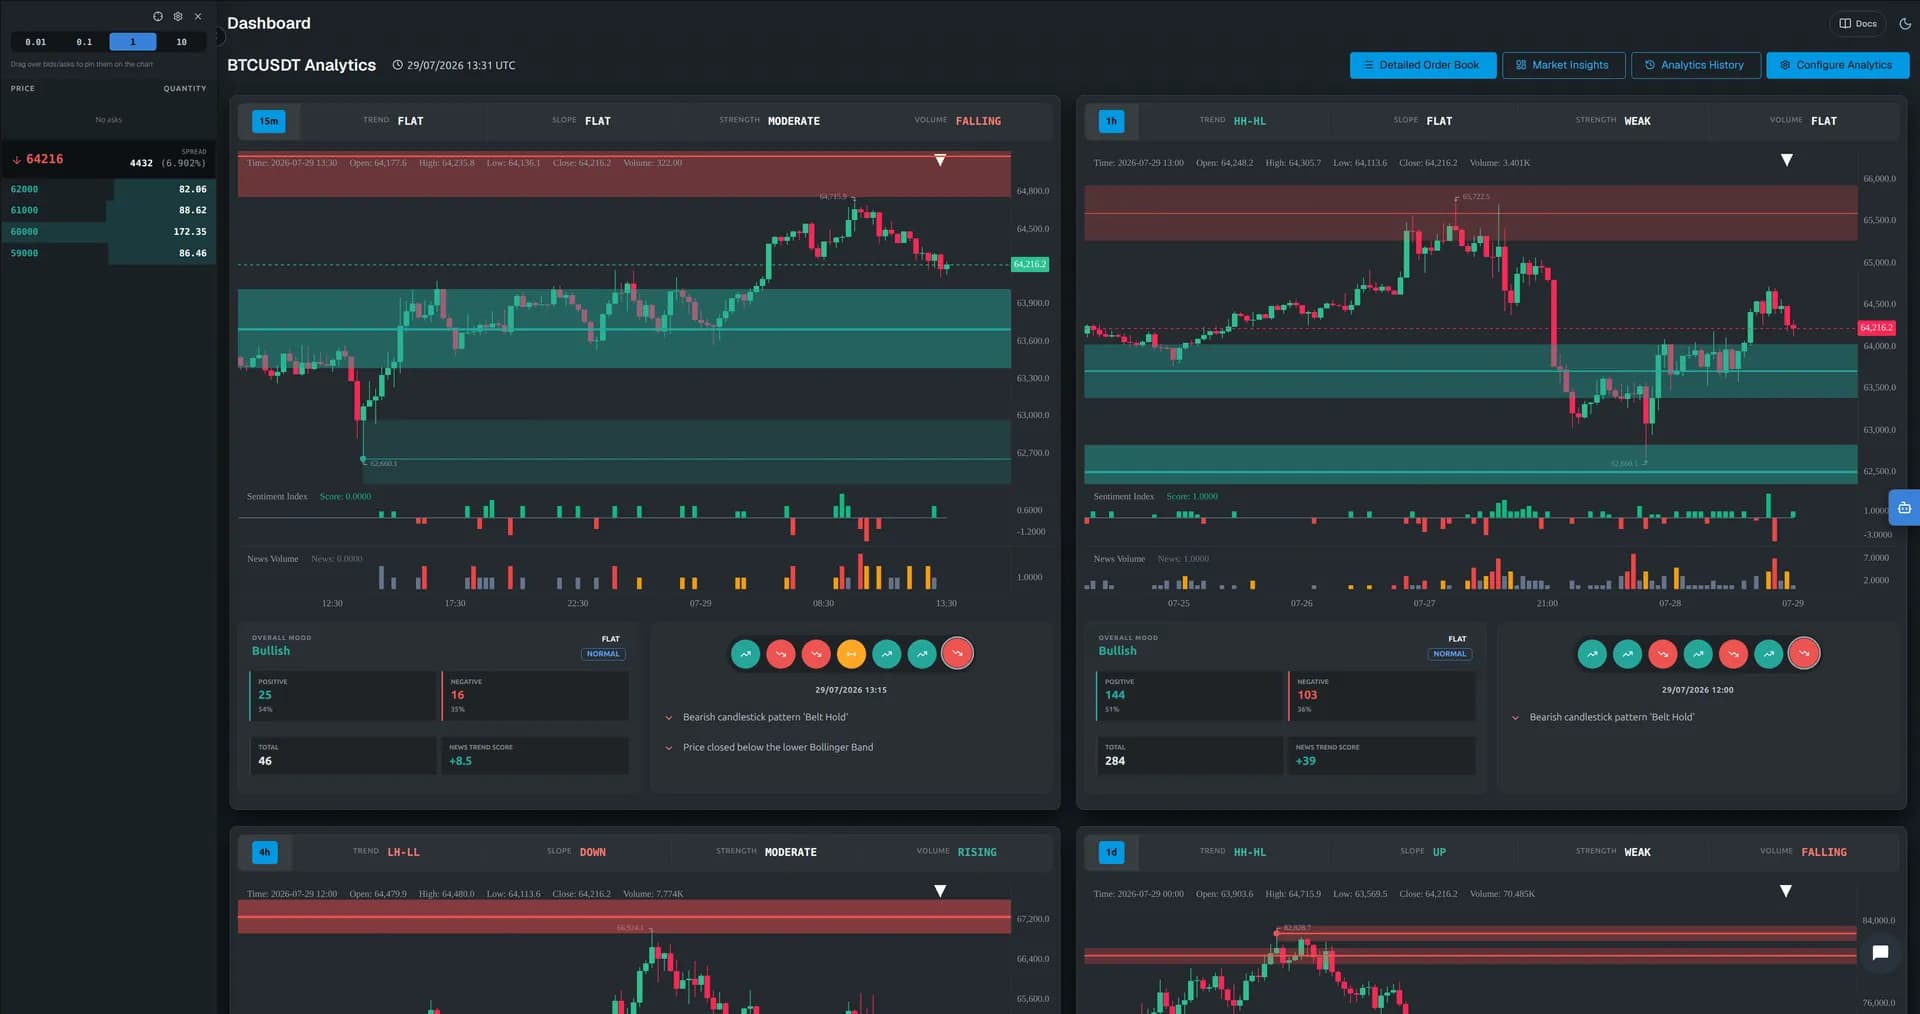
Market analytics — one screen per asset
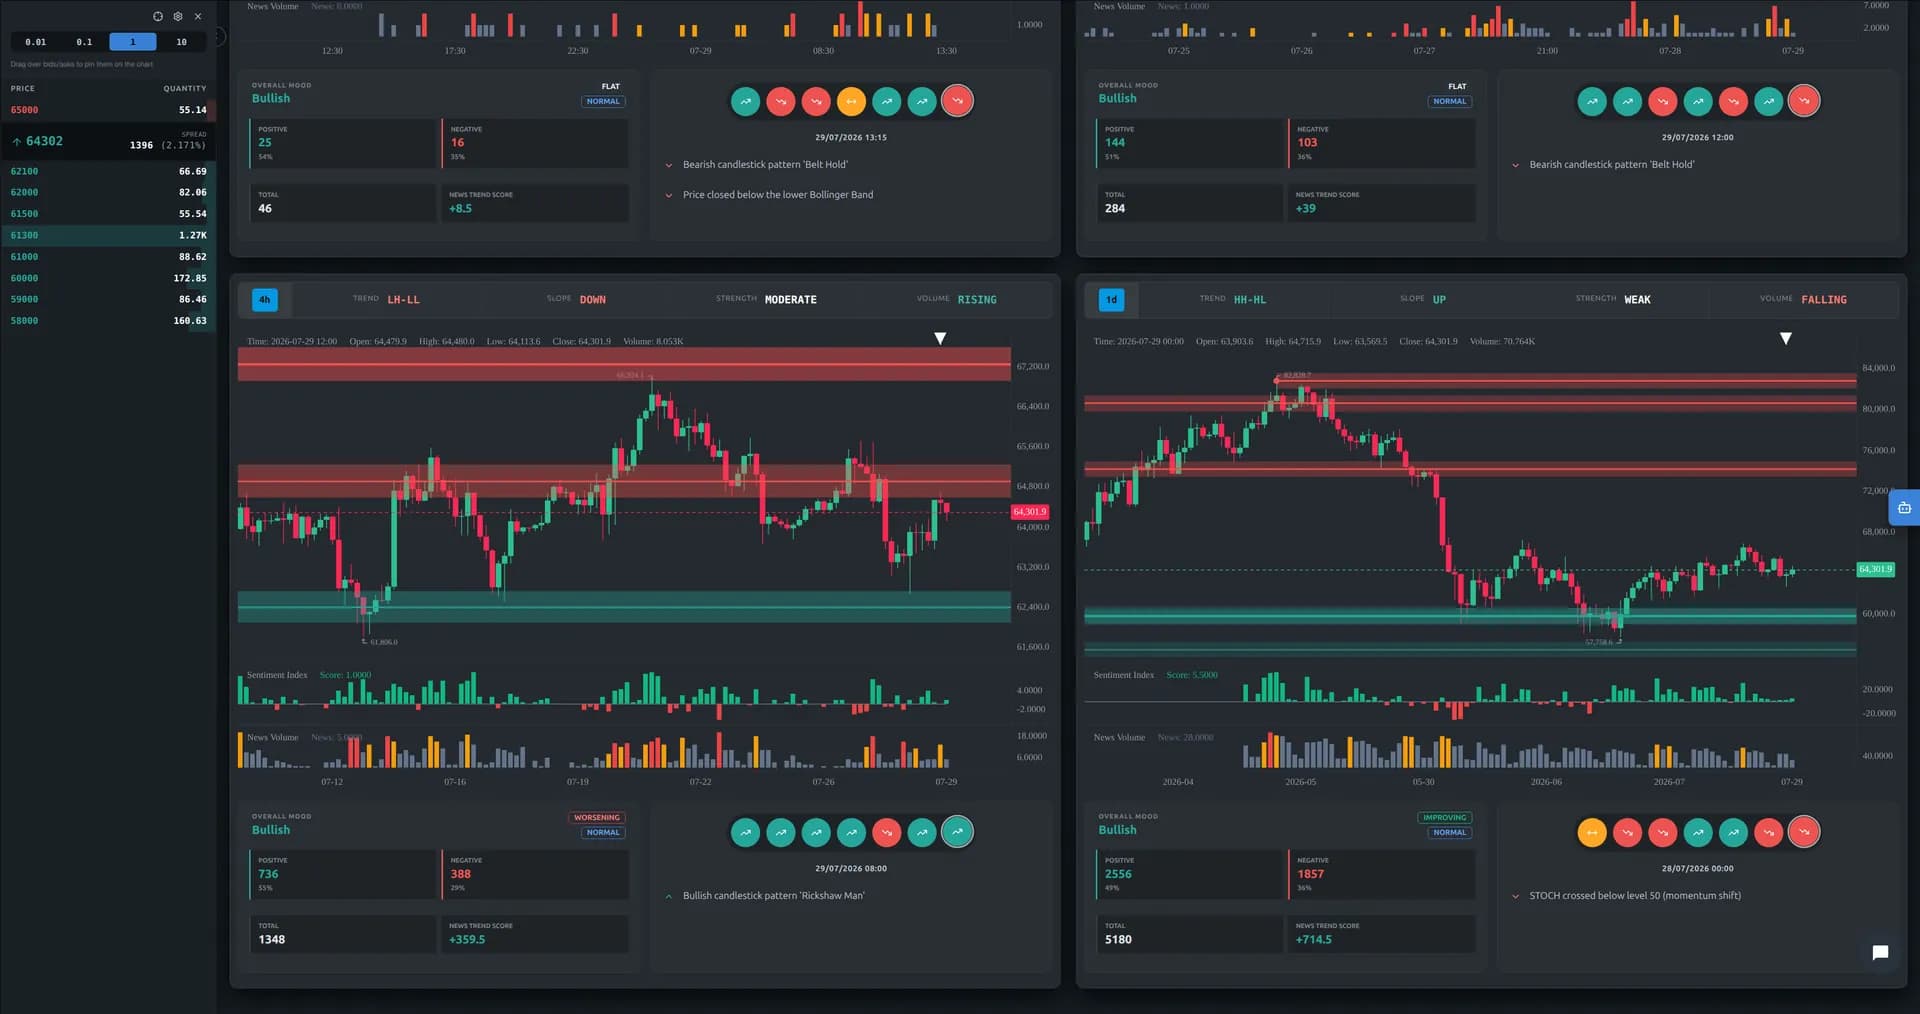
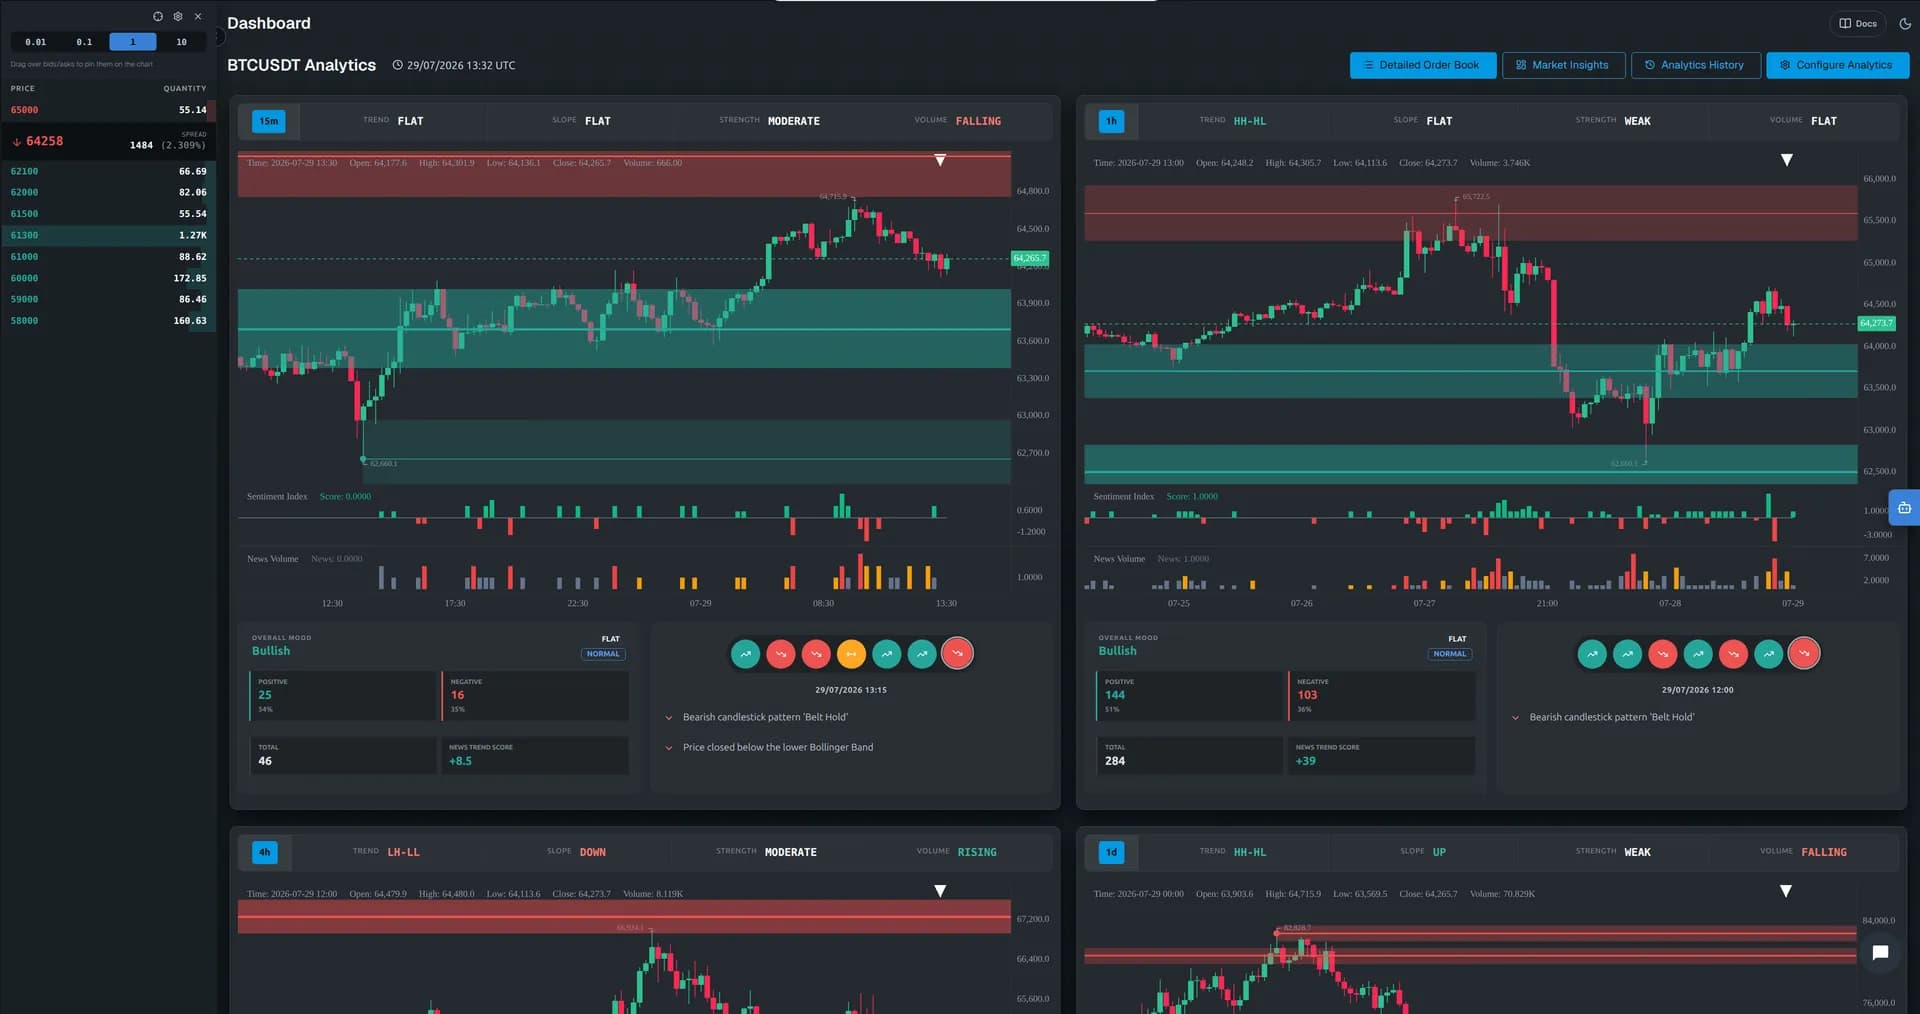
Add an asset — get its whole context in one place: four timeframes, chart events, AI-read news, a live order book and the macro regime. No recommendations, no “buy now”: raw data, honestly labeled. You build the picture.
Four-timeframe report
15m, 1h, 4h and 1d side by side: trend structure (HH-HL / LH-LL), slope, ADX-based strength and volume — plus support and resistance levels that carry a score, touch count and reaction strength, not just a line someone drew.
Chart events
A rolling 7-bar window on every timeframe highlights hidden factors — divergences, band breakouts after a squeeze, momentum shifts. Click a marker and see exactly which candle it points at, and why.
News, read by AI — twice
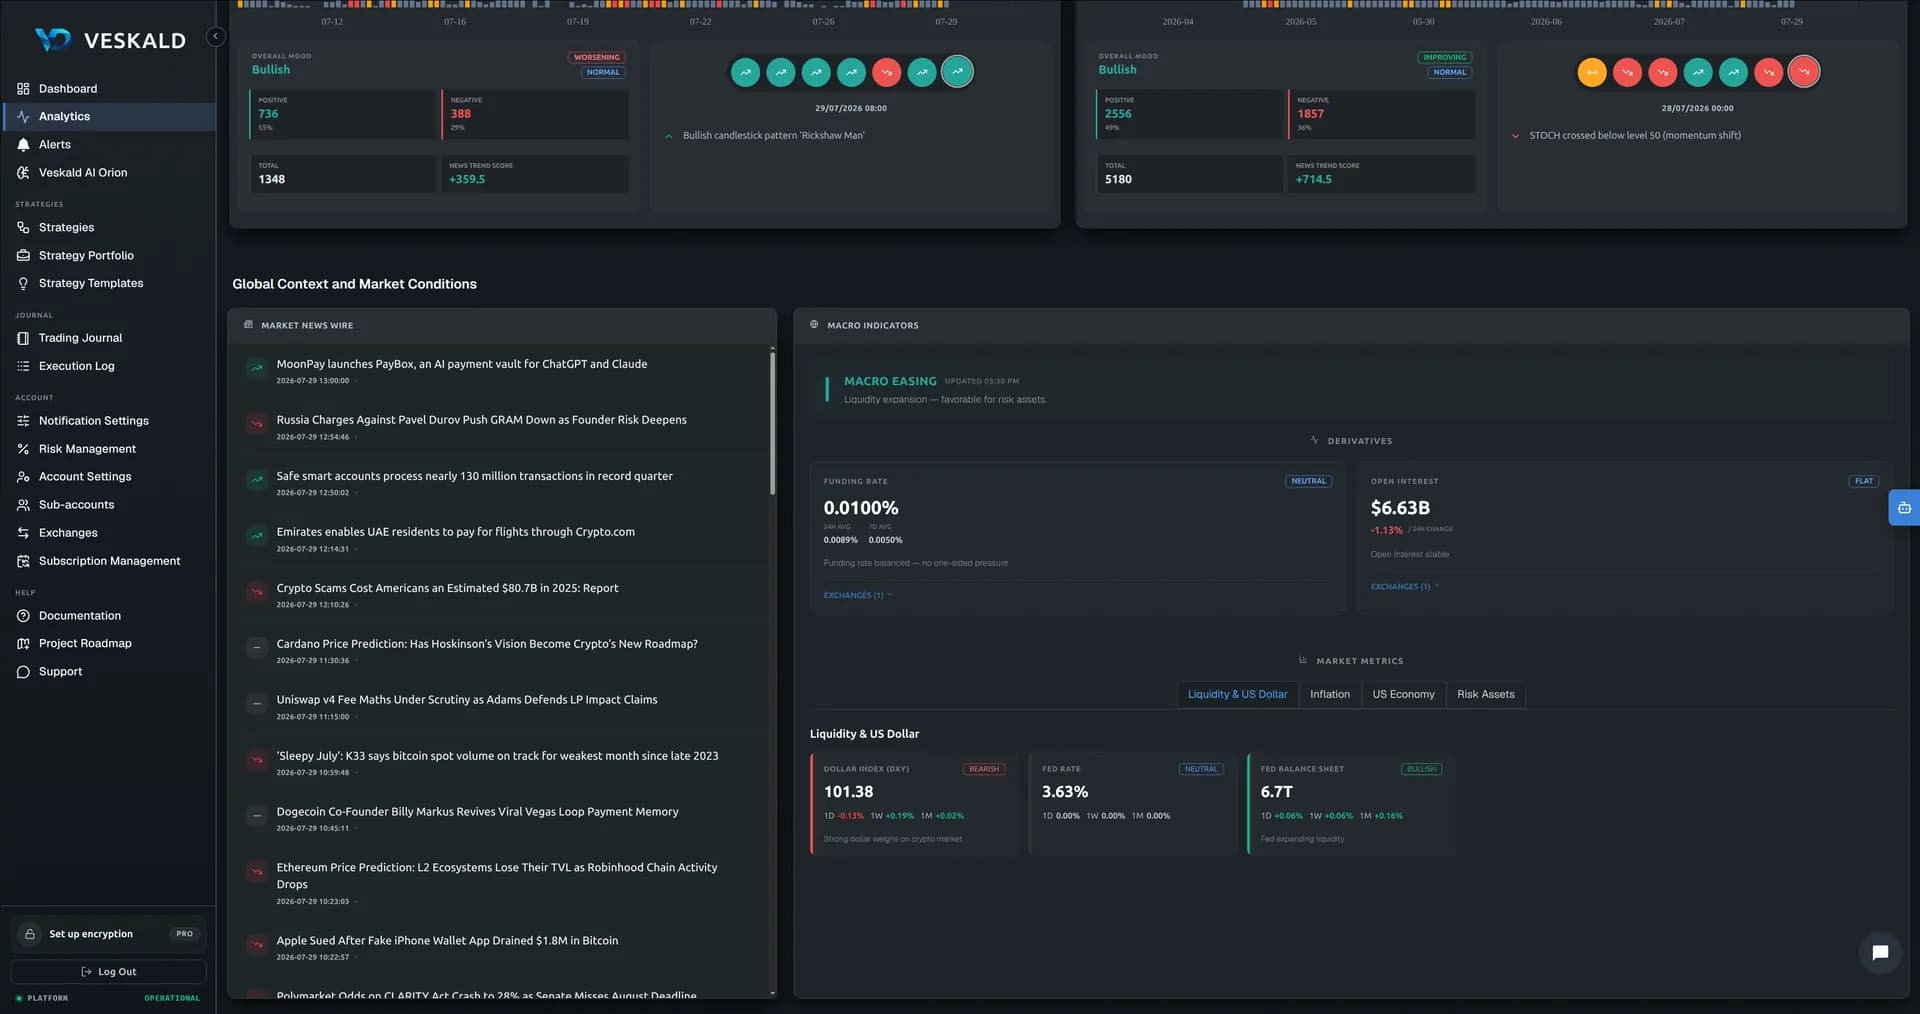
The news wire runs through two separate AIs: the first decides whether a piece of news deserves attention at all, the second scores what passed — sentiment and impact. Both are tuned on our own verified data, not a raw scrape of public feeds. Scores align with the chart by release time — price makes a new low while negativity dries up? That divergence is the point.
Live order book, pinned to the chart
Depth, walls and spread — live. Drag across the book to pin liquidity zones straight onto the levels chart, next to support and resistance.
Macro regime
One banner answers “what mode is the market in”: Easing, Tightening or Neutral. Behind it — funding and open interest across exchanges on one chart, 14 macro metrics with 1D/1W/1M changes, and an event calendar with countdowns.
Open any past date and see what the report showed before the move — not after it. Analytics you can check is the only kind worth reading.
Trading journal and Execution Log
A spreadsheet stores what you typed. The journal records what actually happened.
Trading journal
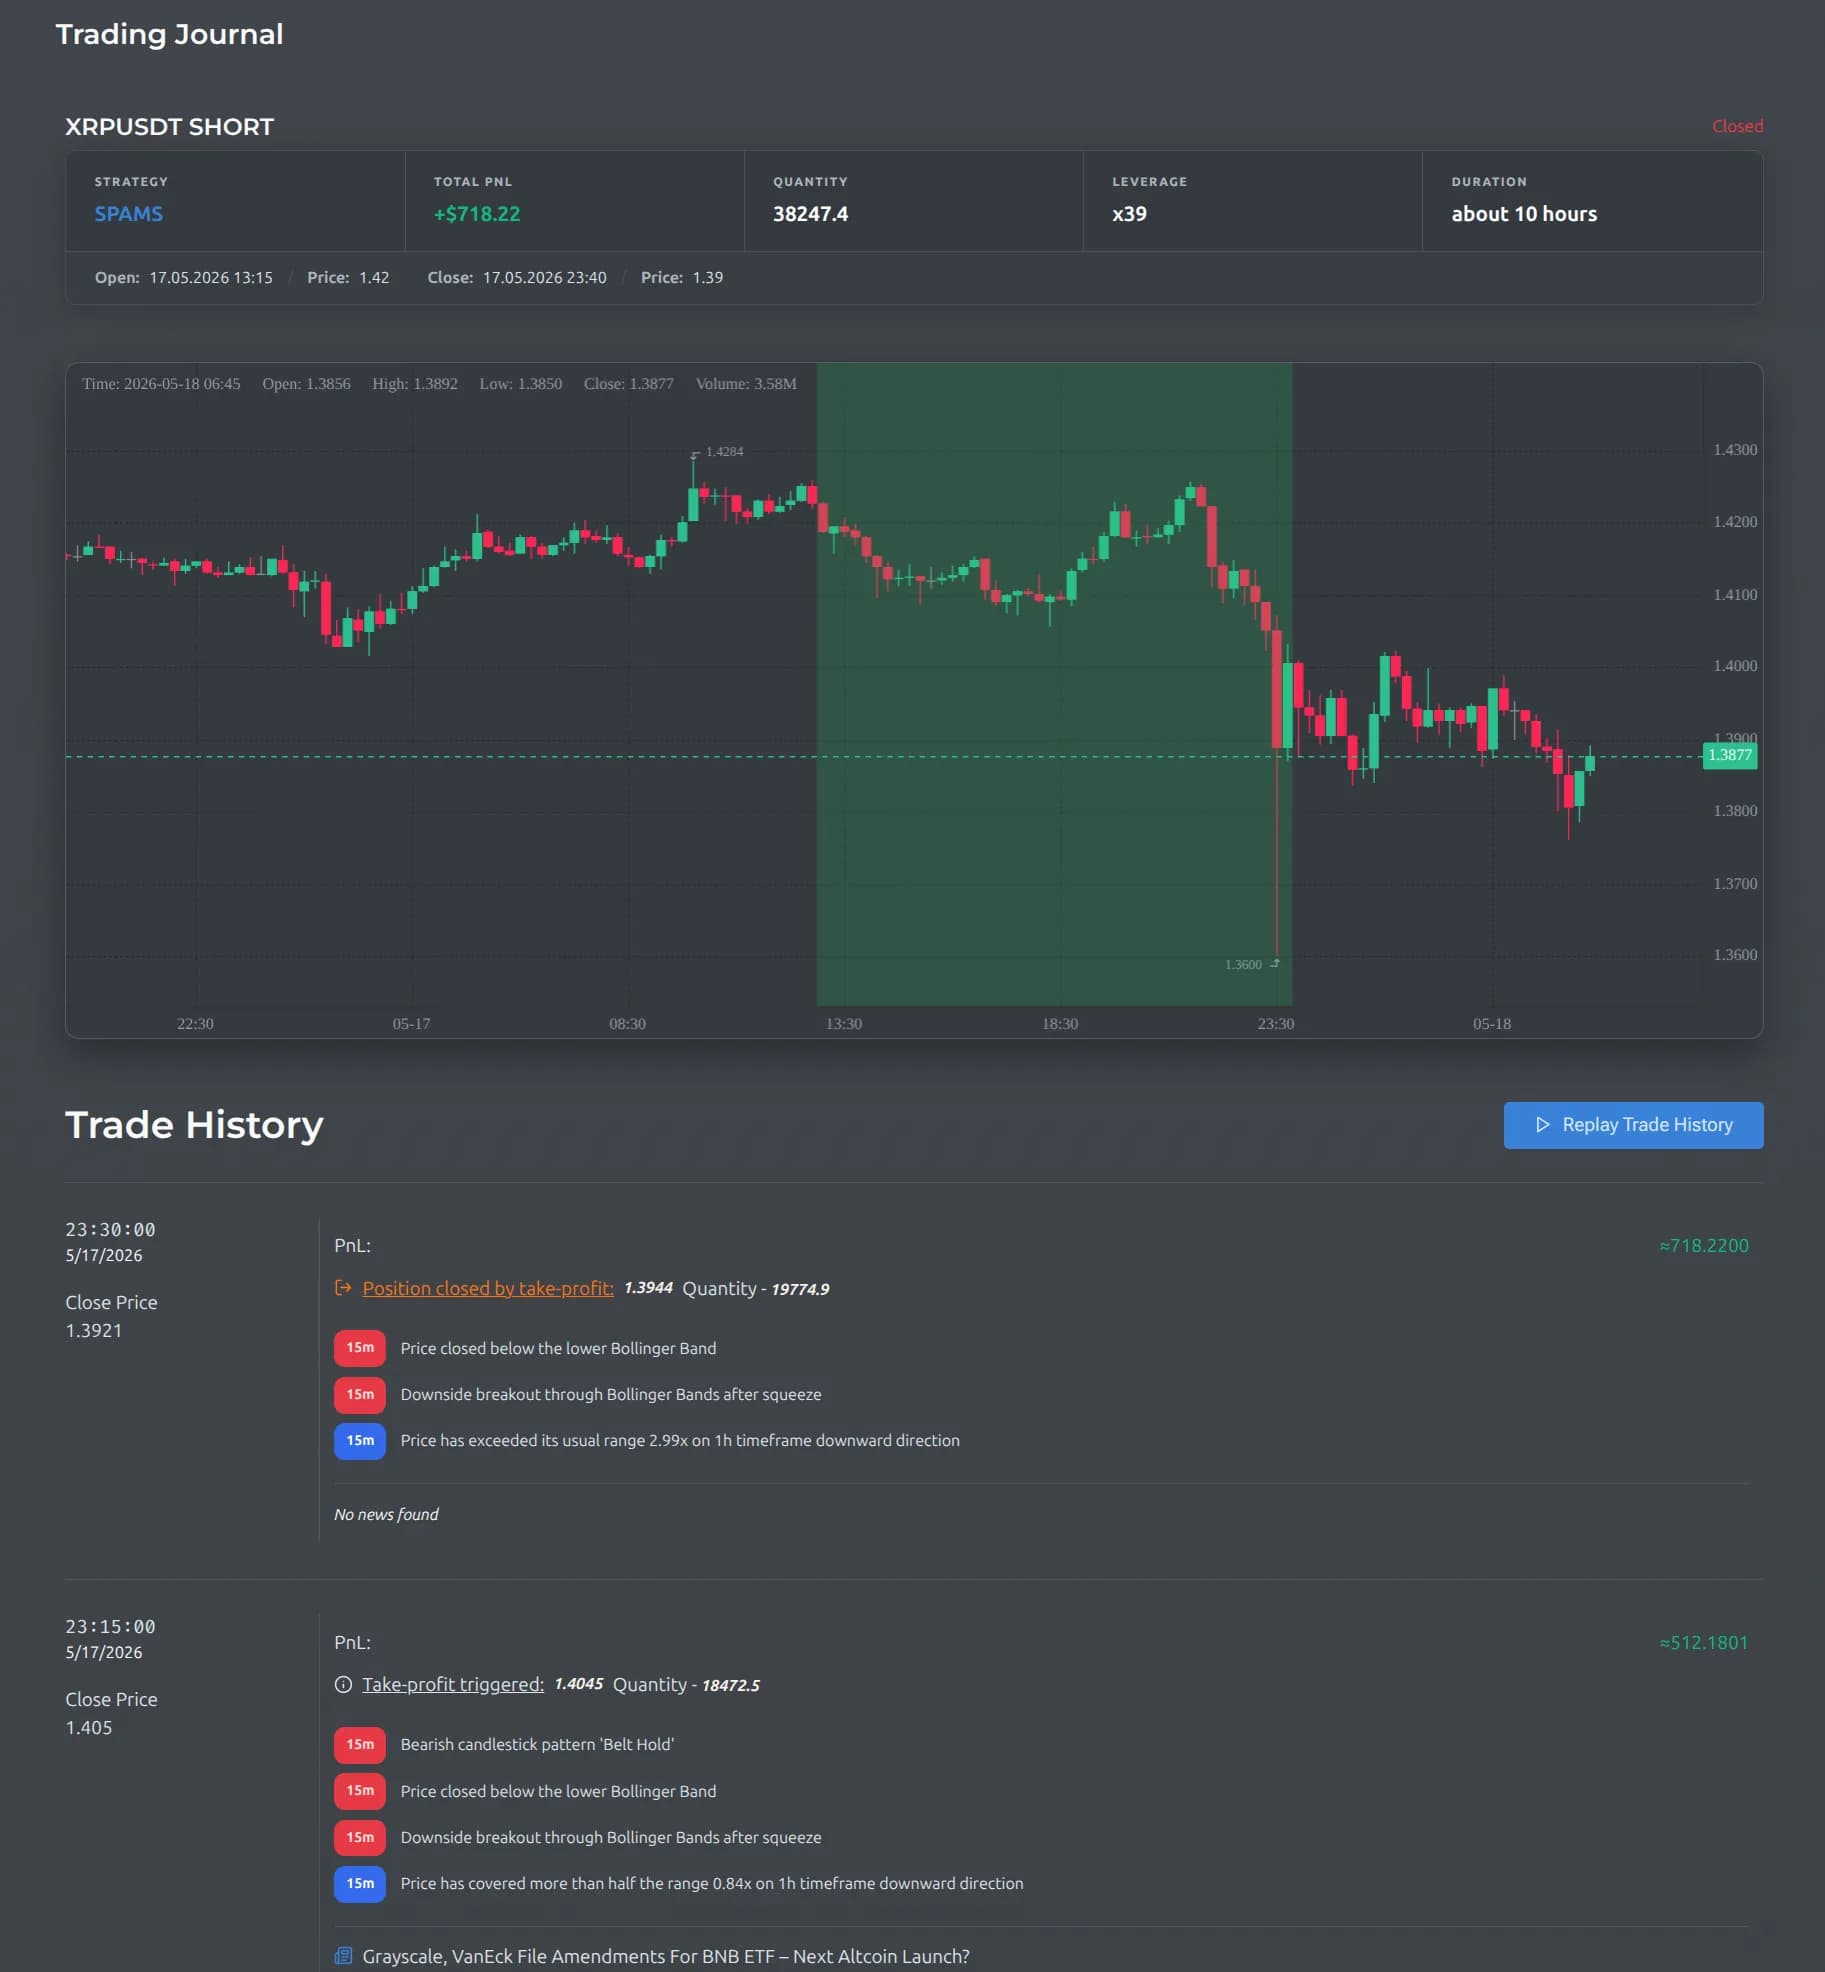
Every fill is recorded straight from the exchange — no gaps, no forgotten entries, no mistyped sizes: the human factor is out. And every trade keeps its market context: open it and replay candle by candle, like a video player for the chart. You see how the situation unfolded, what news was happening at every candle, and what decisions the strategy made. Panic-closed a trade that then went your way? The journal shows what that decision cost.
Execution Log
Forward testing tells you that a gap exists; the Execution Log shows where it comes from. Every order and fill is taken from the exchange’s own record, with its timestamp, and set next to what the test expected: fill price, commission, slippage. Your manual trades are kept apart from the strategy’s own. A one-off mismatch is market noise; the same mismatch again and again means the cost settings or the strategy’s parameters need another look.
One strategy is a bet. A portfolio is a system.
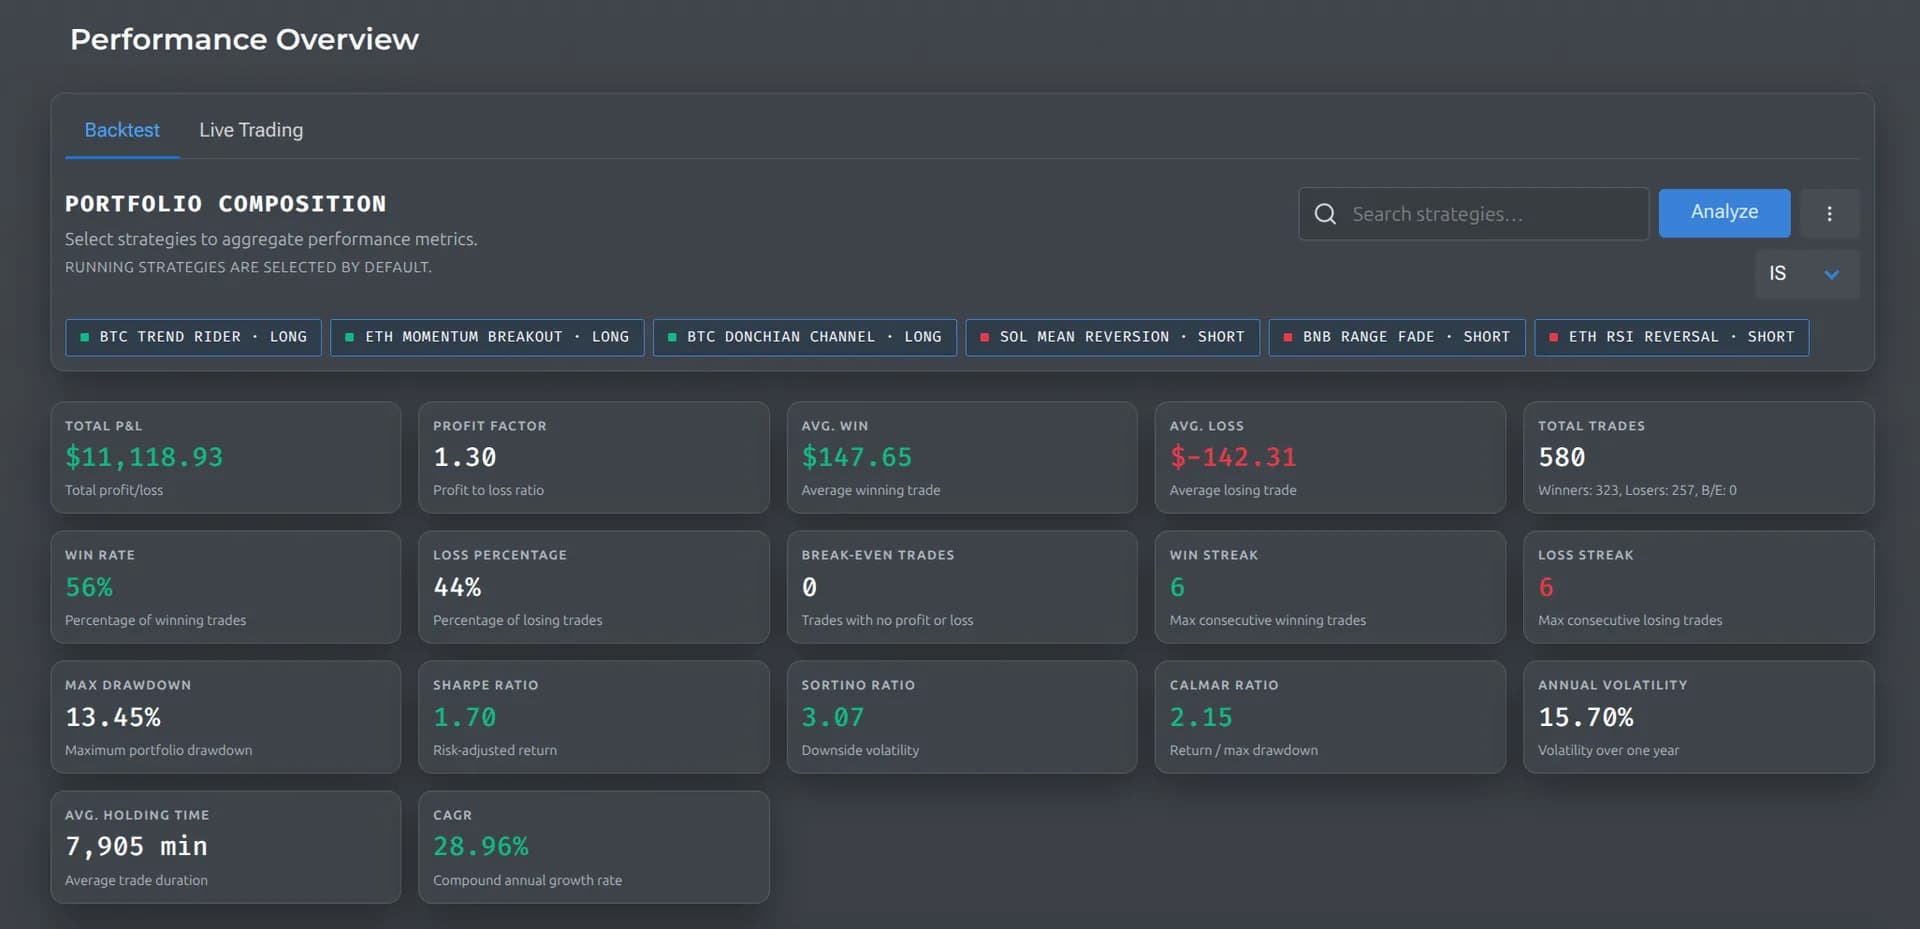
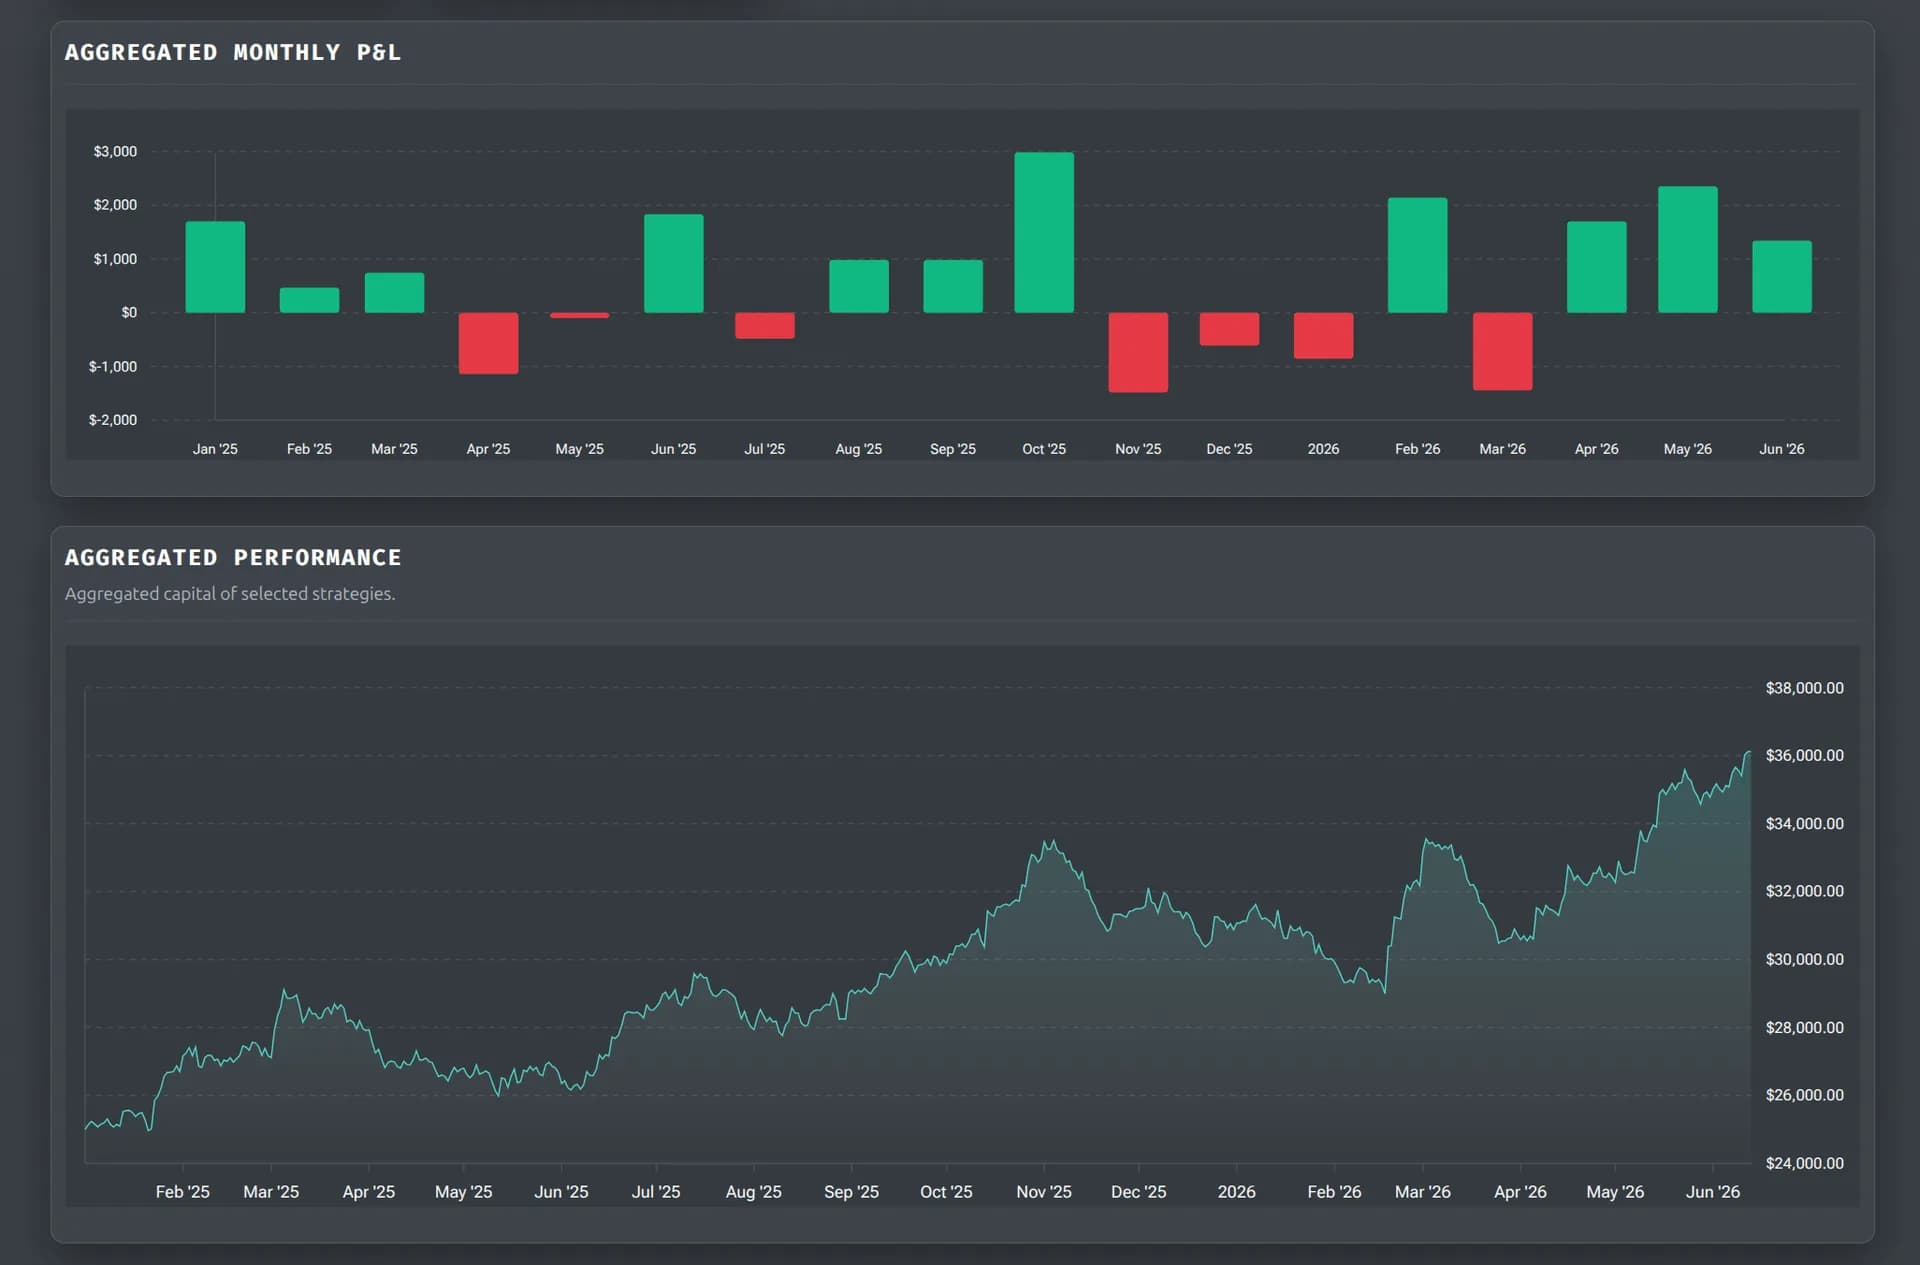
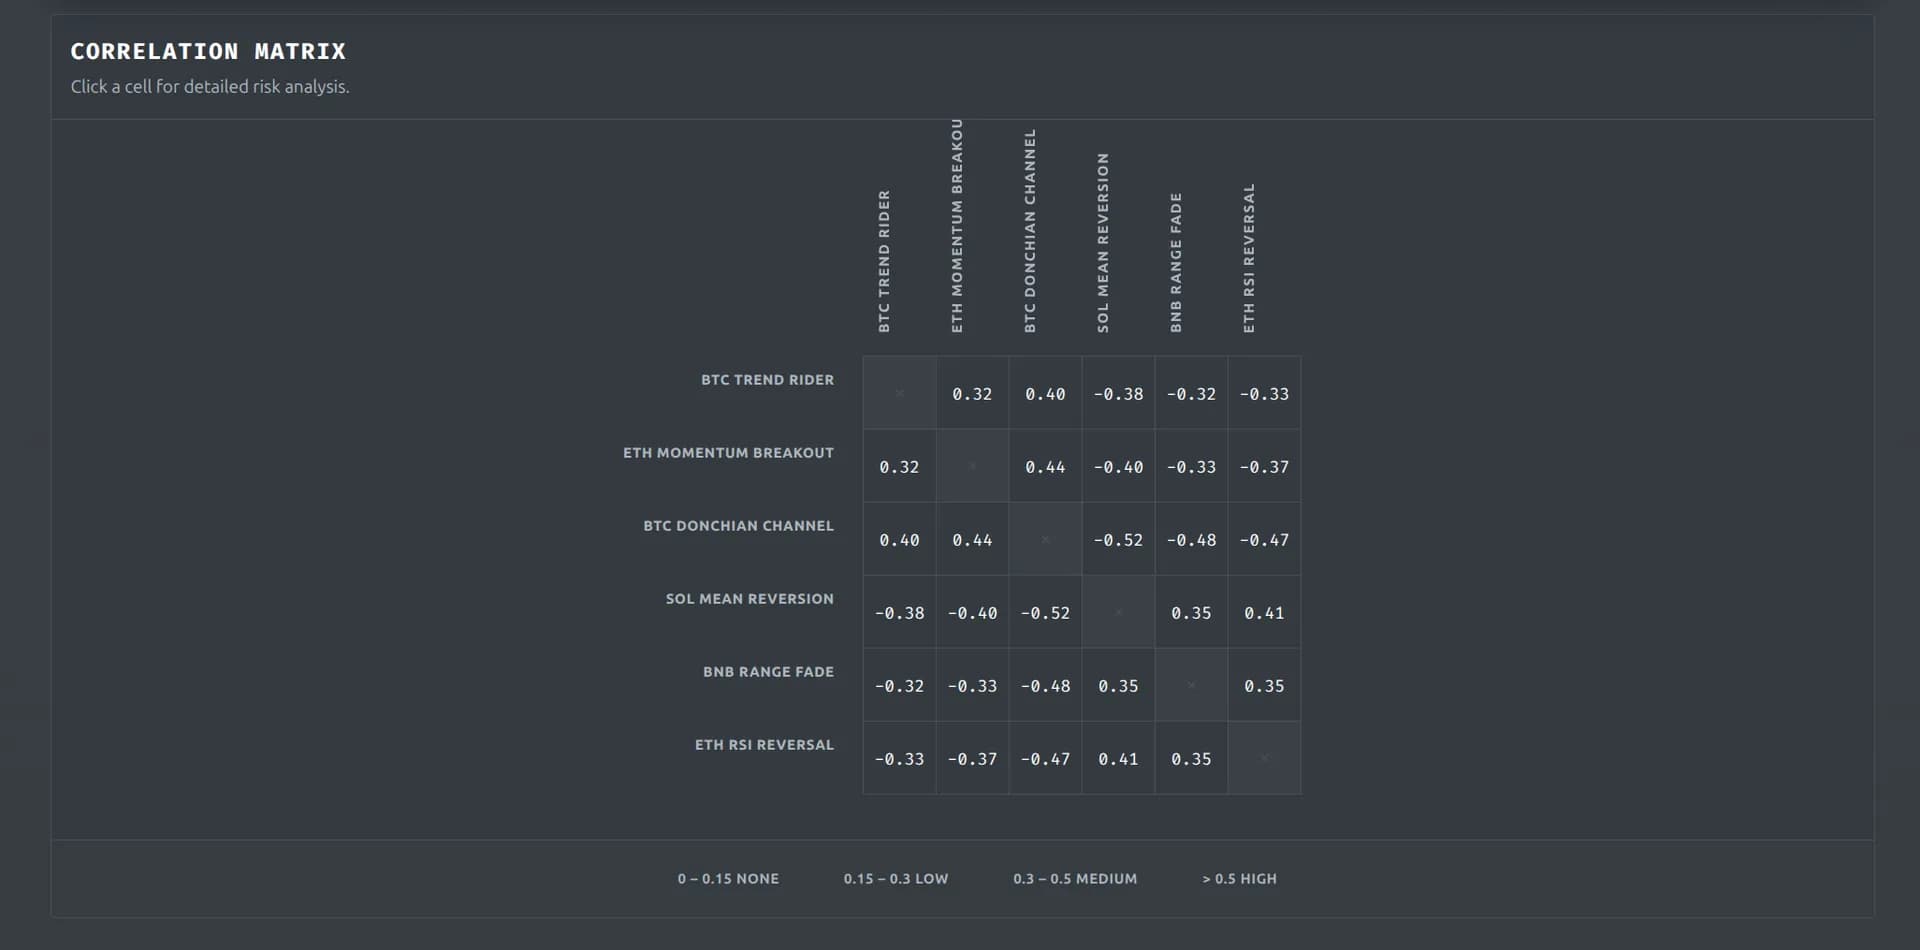
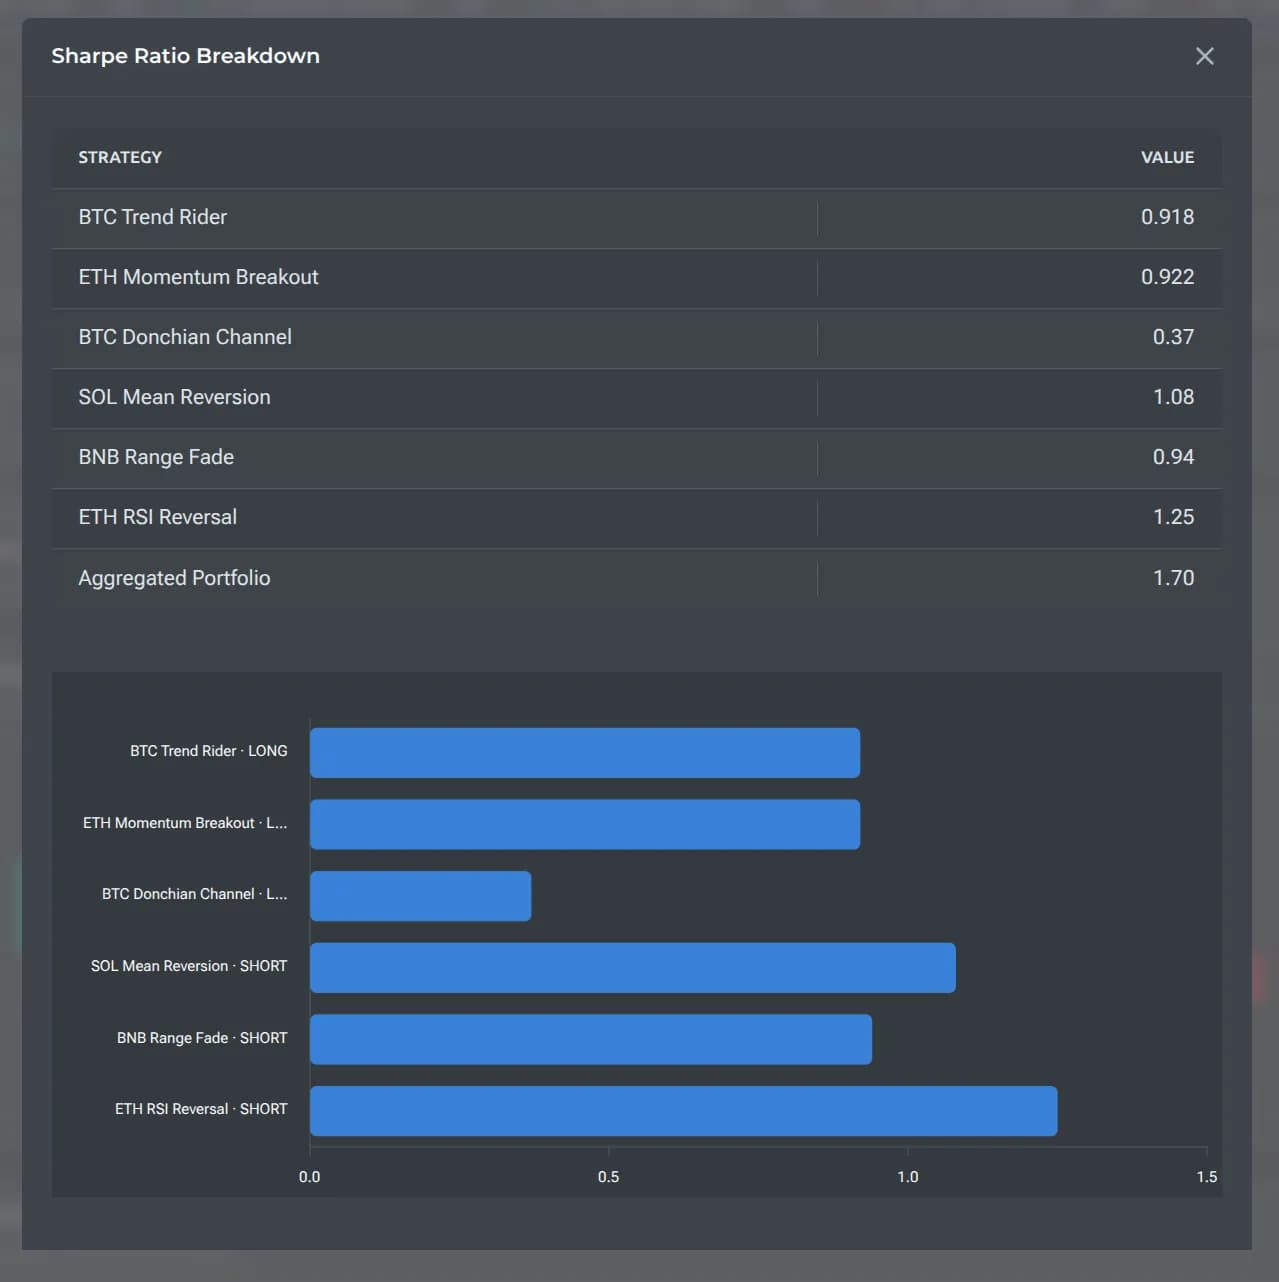
Combine several strategies into one portfolio and see how they behave together: the aggregate equity curve, combined metrics, and how they cover each other’s drawdowns. Veskald uses drawdown correlation: an average over the whole history is dominated by quiet, flat stretches and understates the risk, while what matters is whether strategies lose at the same time. Three ordinary strategies that do not draw down together often give a smoother curve and a shallower drawdown than one “perfect” one.
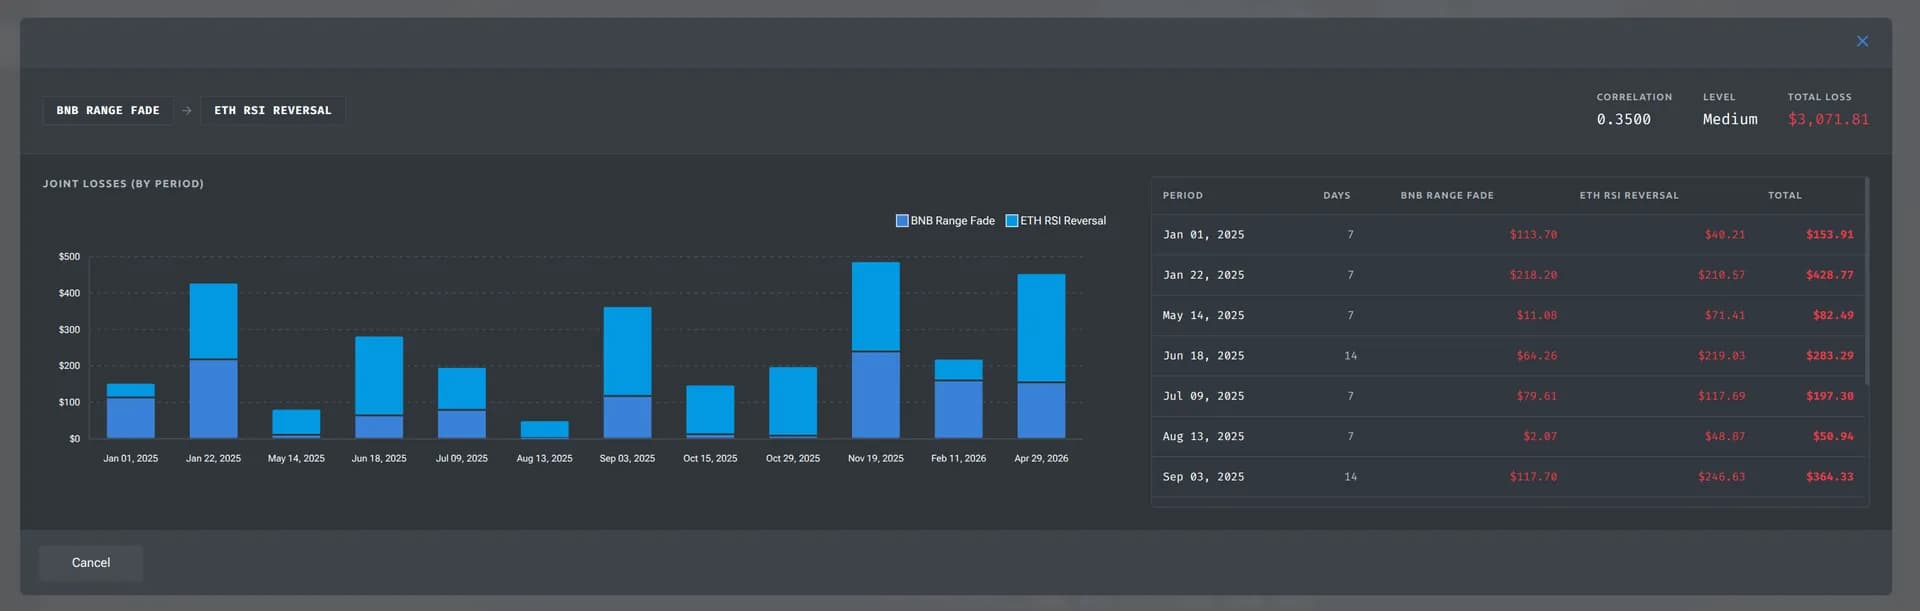
Portfolio-level risk management
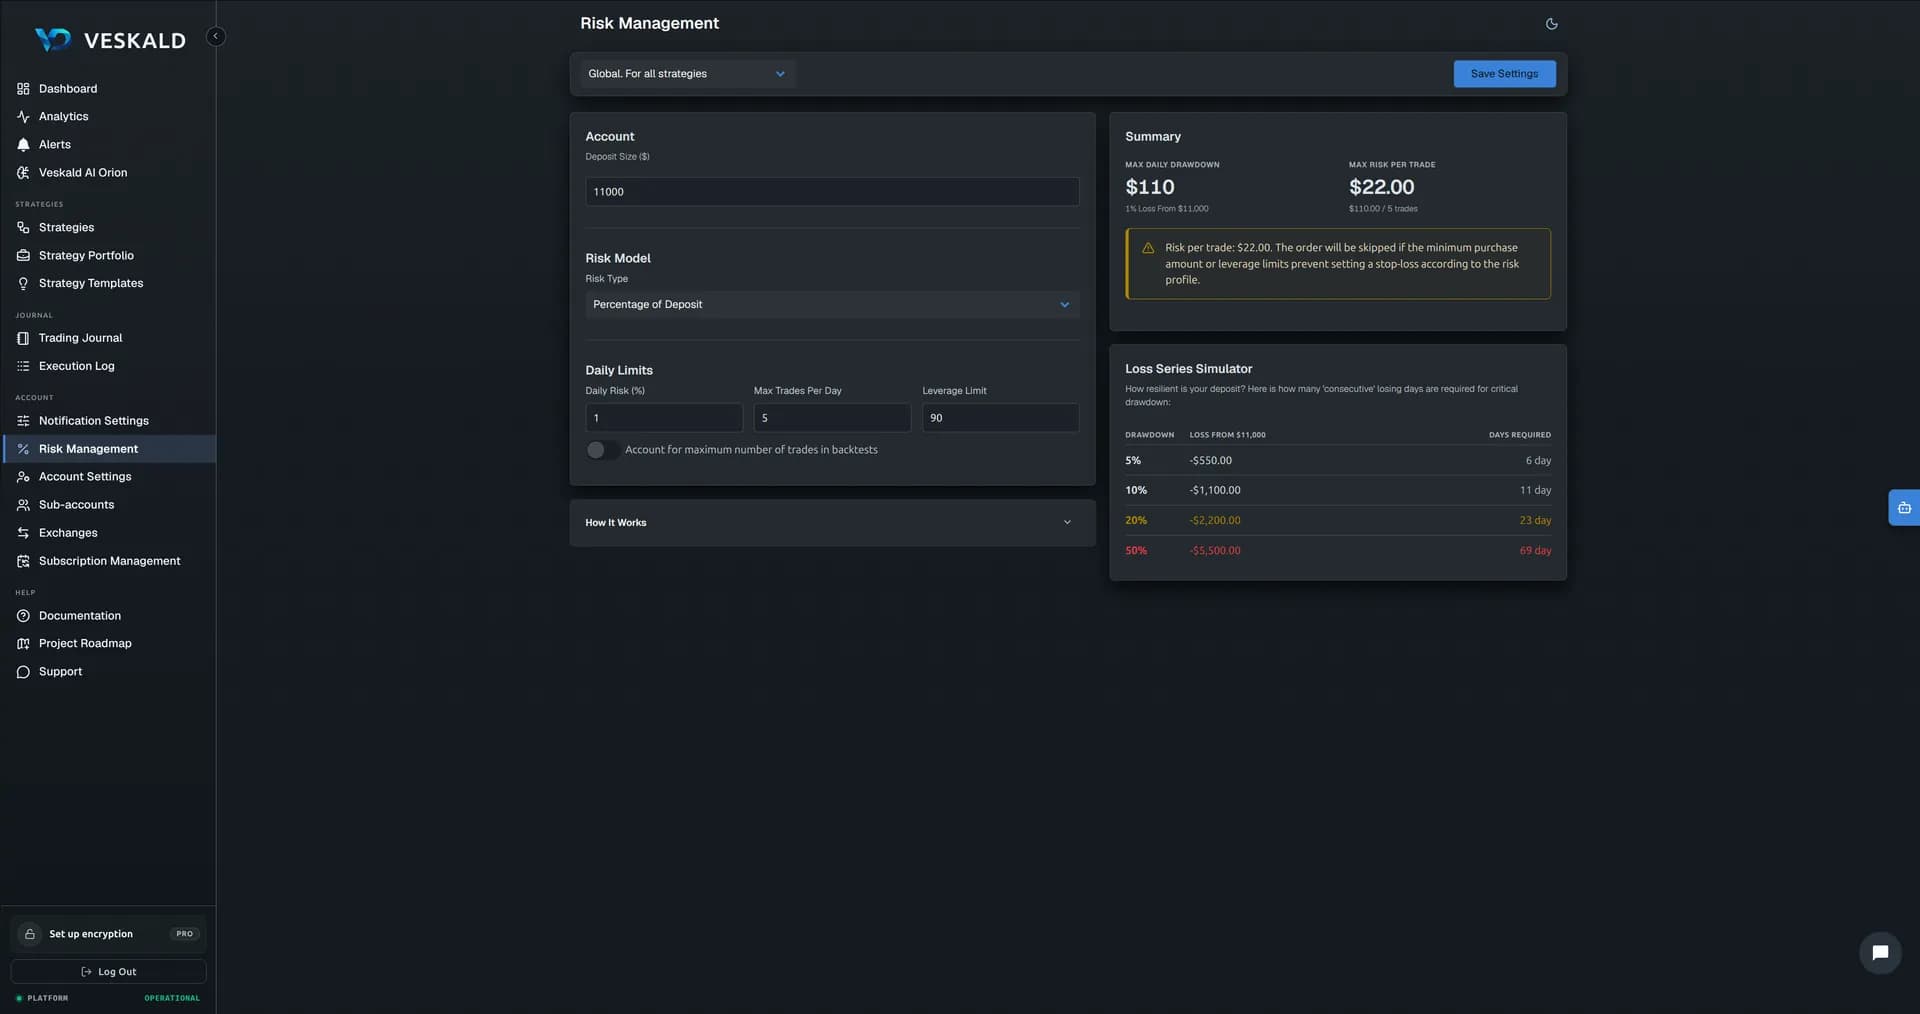
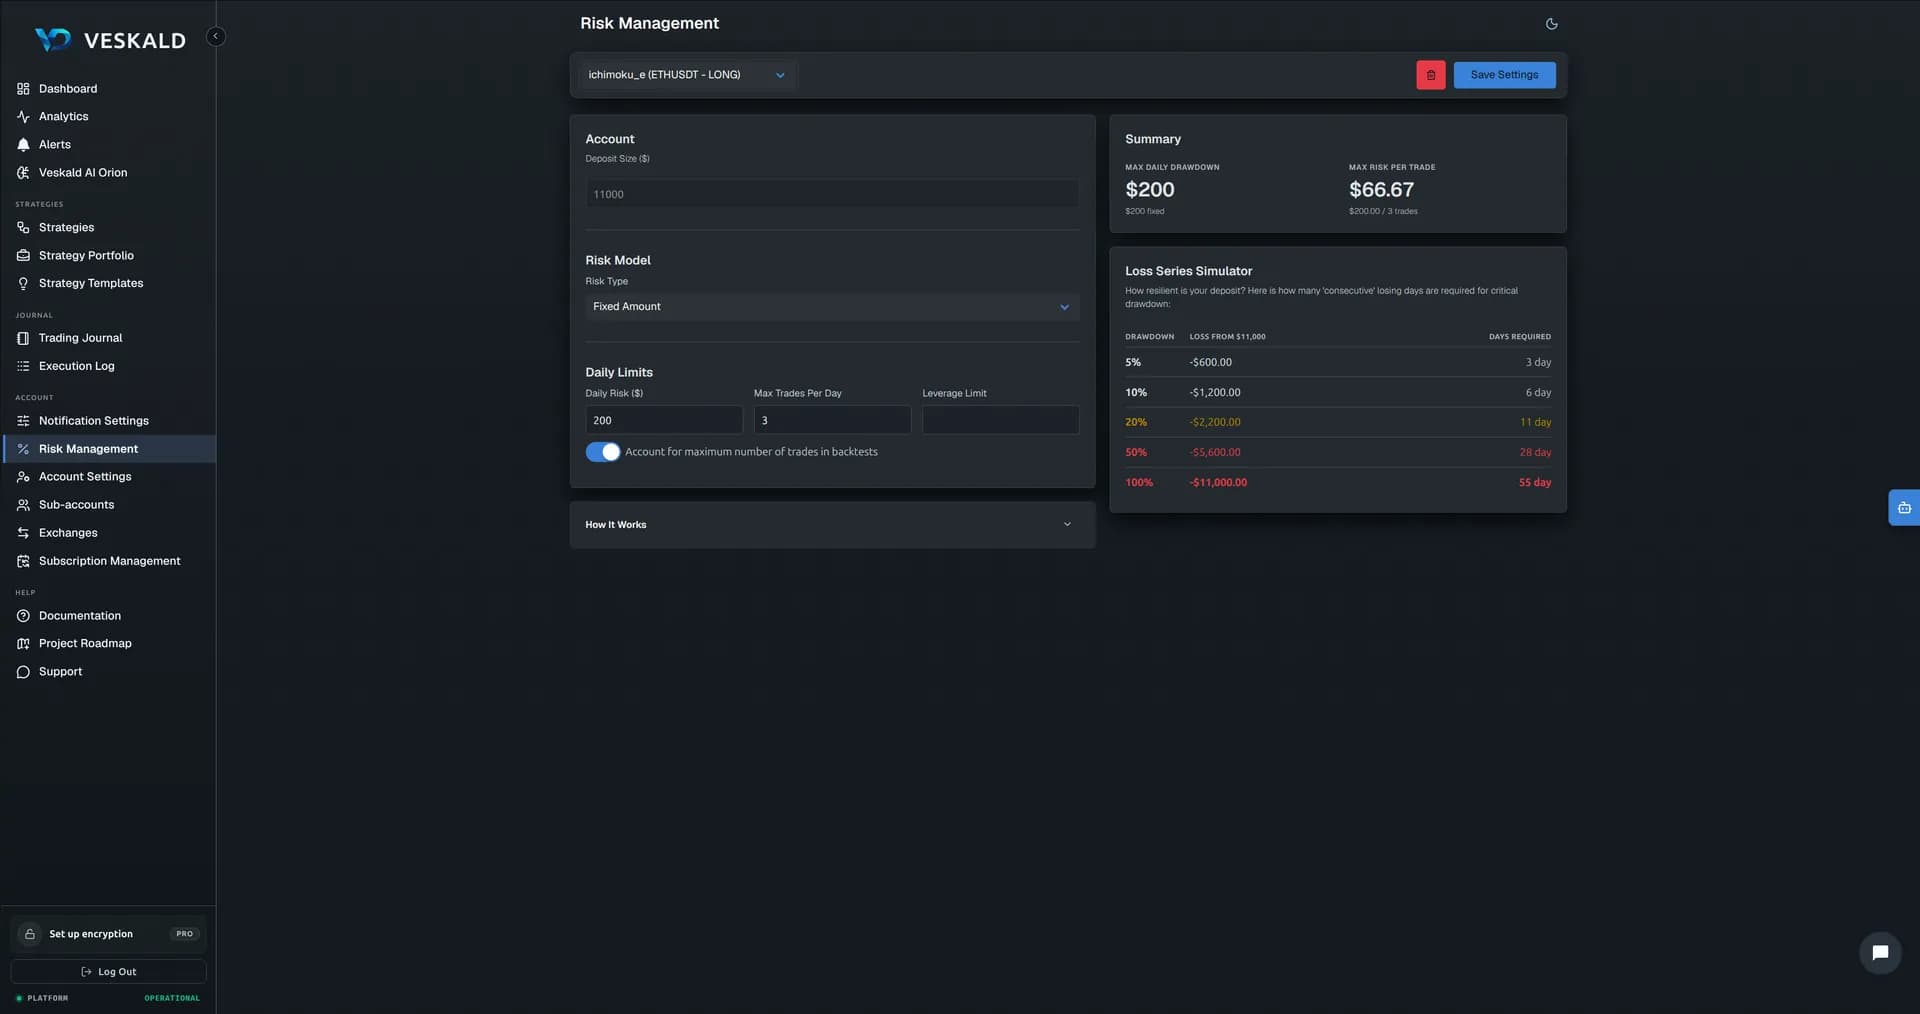
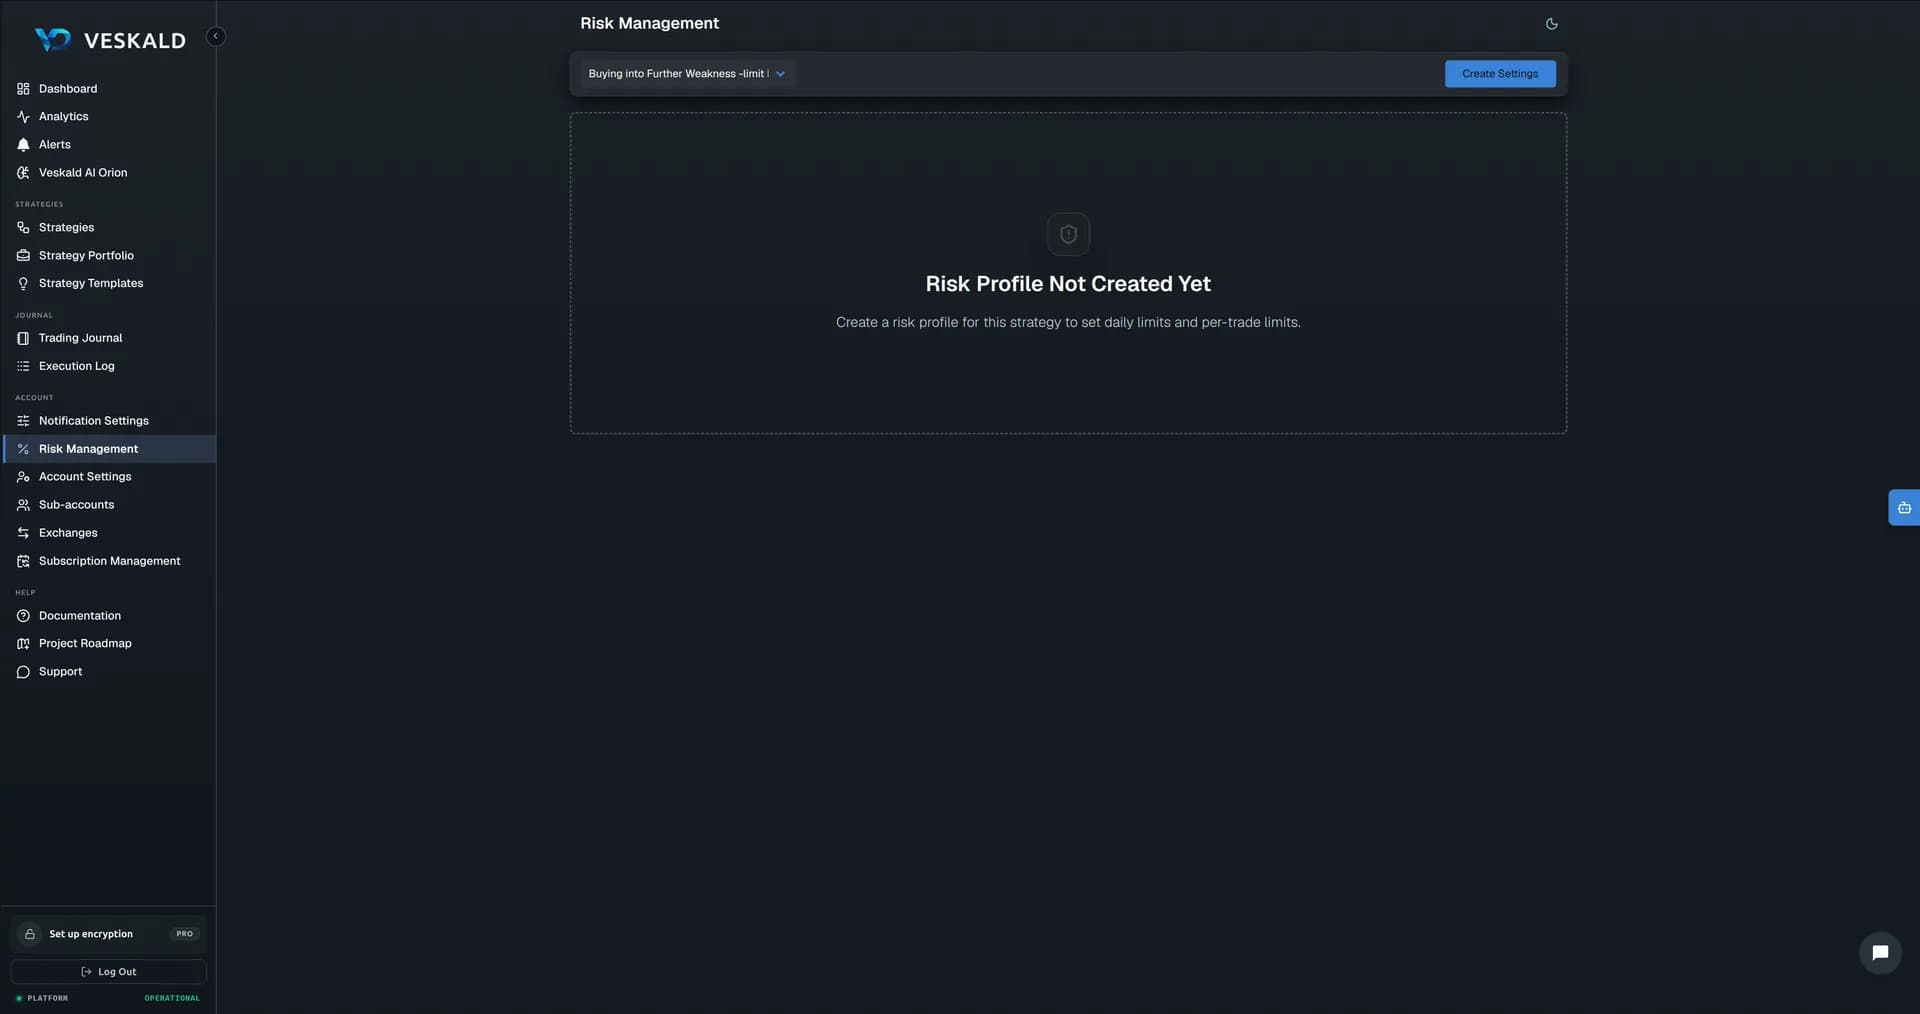
Global rules for all strategies: daily loss limit, max trades per day, leverage cap. Plus per-strategy settings — the global rules act as a safety net, the specific settings refine behavior.
The "What if" calculator shows how many days, given current settings, until you hit a chosen drawdown — so you understand in advance whether your approach is too aggressive.